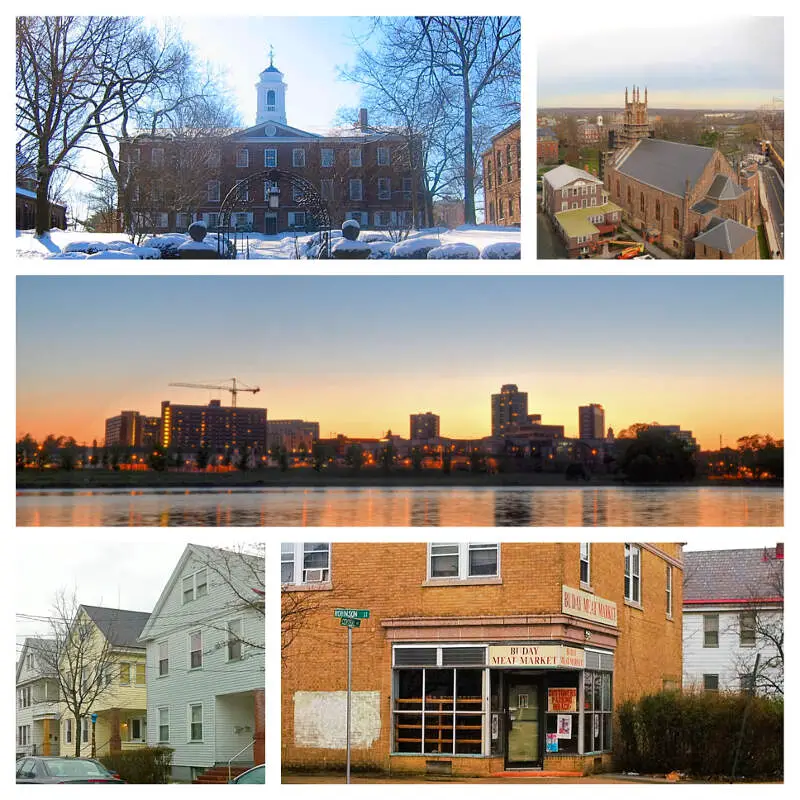
New Brunswick, NJ
Demographics And Statistics
Living In New Brunswick, New Jersey Summary
Life in New Brunswick research summary. HomeSnacks has been using Saturday Night Science to research the quality of life in New Brunswick over the past nine years using Census, FBI, Zillow, and other primary data sources. Based on the most recently available data, we found the following about life in New Brunswick:
The population in New Brunswick is 55,718.
The median home value in New Brunswick is $373,463.
The median income in New Brunswick is $57,138.
The cost of living in New Brunswick is 117 which is 1.2x higher than the national average.
The median rent in New Brunswick is $1,754.
The unemployment rate in New Brunswick is 6.5%.
The poverty rate in New Brunswick is 31.9%.
The average high in New Brunswick is 64.0° and the average low is 42.6°.
New Brunswick SnackAbility
Overall SnackAbility
New Brunswick, NJ Crime Report
Crime in New Brunswick summary. We use data from the FBI to determine the crime rates in New Brunswick. Key points include:
There were 1,691 total crimes in New Brunswick in the last reporting year.
The overall crime rate per 100,000 people in New Brunswick is 3,021.2 / 100k people.
The violent crime rate per 100,000 people in New Brunswick is 857.6 / 100k people.
The property crime rate per 100,000 people in New Brunswick is 2,163.6 / 100k people.
Overall, crime in New Brunswick is 29.99% above the national average.
Total Crimes
Above National Average
Crime In New Brunswick Comparison Table
| Statistic | Count Raw |
New Brunswick / 100k People |
New Jersey / 100k People |
National / 100k People |
|---|---|---|---|---|
| Total Crimes Per 100K | 1,691 | 3,021.2 | 1,353.6 | 2,324.2 |
| Violent Crime | 480 | 857.6 | 195.4 | 369.8 |
| Murder | 4 | 7.1 | 3.7 | 6.3 |
| Robbery | 217 | 387.7 | 49.4 | 66.1 |
| Aggravated Assault | 212 | 378.8 | 127.9 | 268.2 |
| Property Crime | 1,211 | 2,163.6 | 1,158.2 | 1,954.4 |
| Burglary | 152 | 271.6 | 146.2 | 269.8 |
| Larceny | 959 | 1,713.4 | 896.3 | 1,401.9 |
| Car Theft | 100 | 178.7 | 115.7 | 282.7 |
New Brunswick, NJ Cost Of Living
Cost of living in New Brunswick summary. We use data on the cost of living to determine how expensive it is to live in New Brunswick. Real estate prices drive most of the variance in cost of living around New Jersey. Key points include:
The cost of living in New Brunswick is 117 with 100 being average.
The cost of living in New Brunswick is 1.2x higher than the national average.
The median home value in New Brunswick is $373,463.
The median income in New Brunswick is $57,138.
New Brunswick's Overall Cost Of Living
Higher Than The National Average
Cost Of Living In New Brunswick Comparison Table
| Living Expense | New Brunswick | New Jersey | National Average | |
|---|---|---|---|---|
| Overall | 117 | 111 | 100 | |
| Services | 110 | 104 | 100 | |
| Groceries | 107 | 104 | 100 | |
| Health | 89 | 95 | 100 | |
| Housing | 138 | 130 | 100 | |
| Transportation | 107 | 106 | 100 | |
| Utilities | 109 | 108 | 100 | |
New Brunswick, NJ Weather
The average high in New Brunswick is 64.0° and the average low is 42.6°.
There are 78.1 days of precipitation each year.
Expect an average of 47.7 inches of precipitation each year with 26.5 inches of snow.
| Stat | New Brunswick |
|---|---|
| Average Annual High | 64.0 |
| Average Annual Low | 42.6 |
| Annual Precipitation Days | 78.1 |
| Average Annual Precipitation | 47.7 |
| Average Annual Snowfall | 26.5 |
Average High
Days of Rain
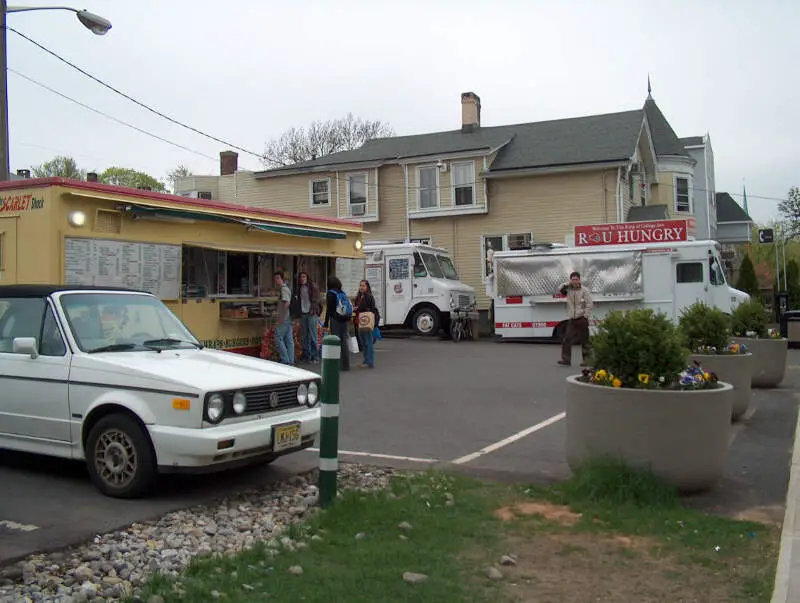
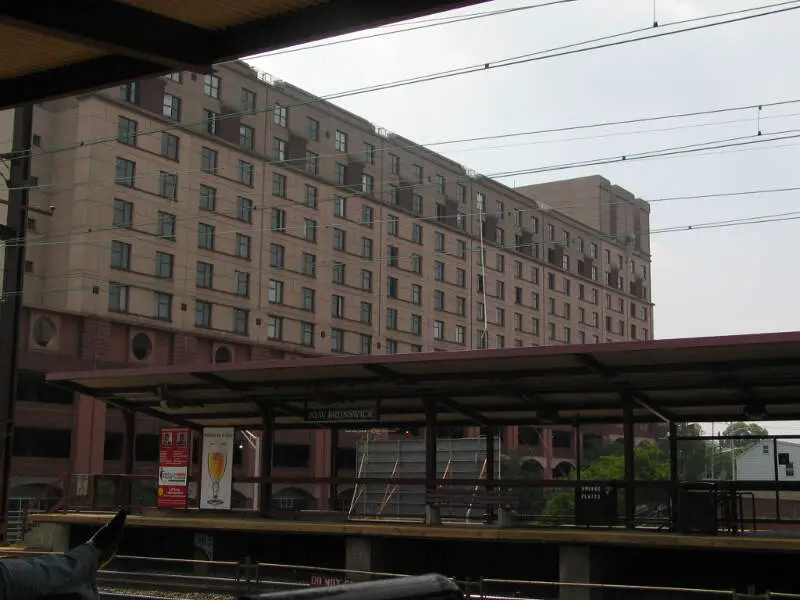
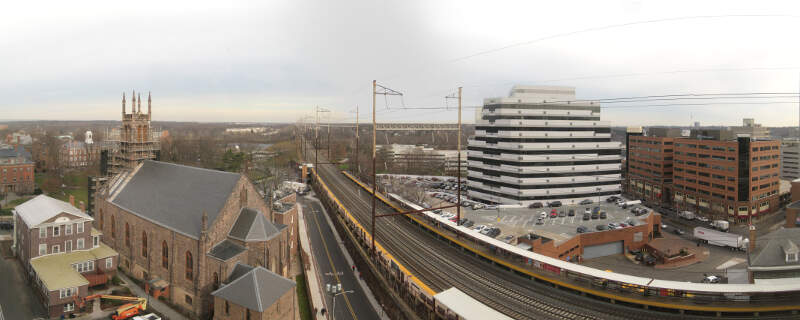
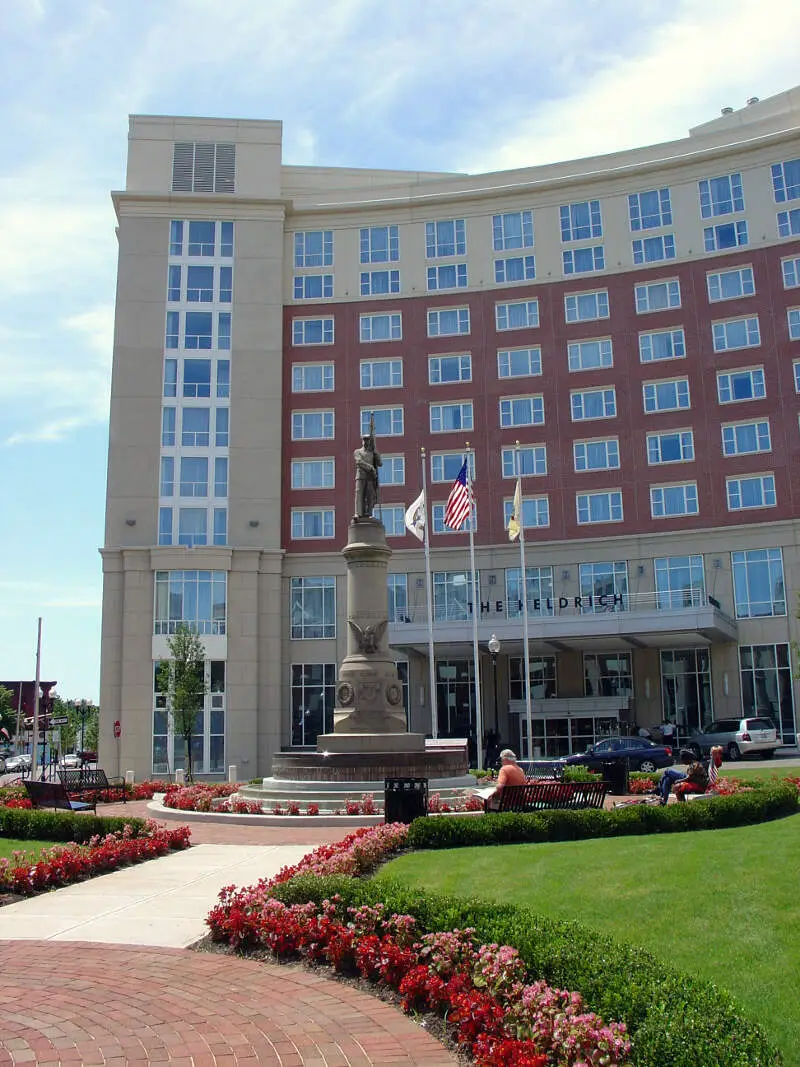
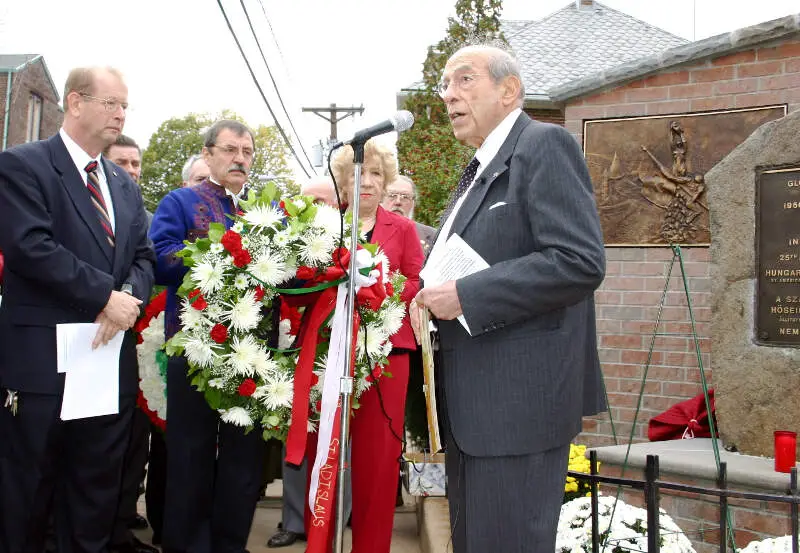
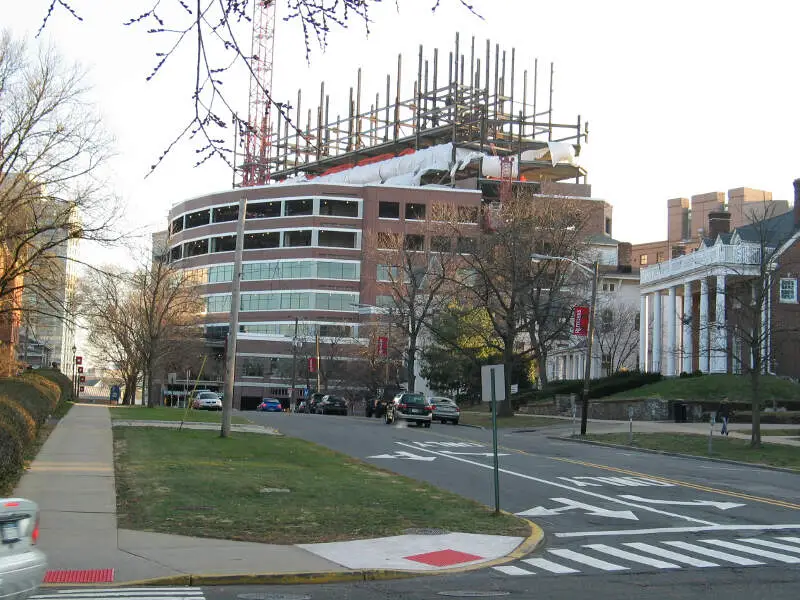
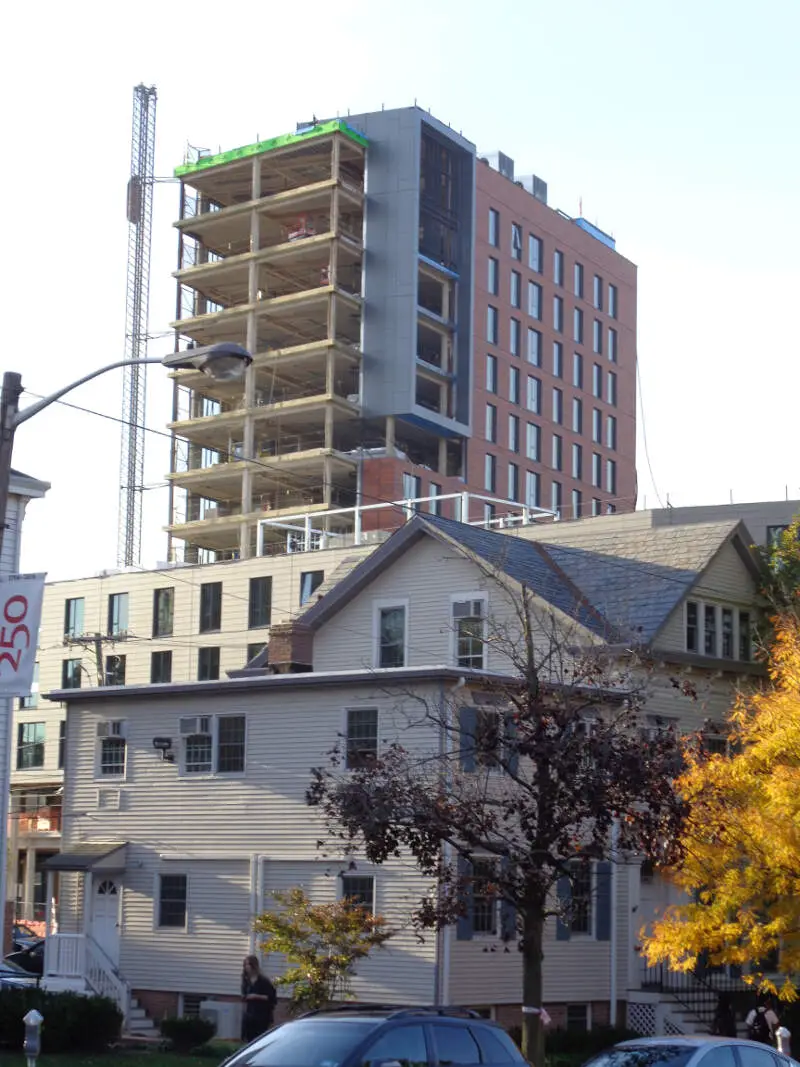
New Brunswick, NJ Photos

1 Reviews & Comments About New Brunswick
/5

HomeSnacks User - 2018-08-20 18:51:17.127901
A LOT OF CRIME REPORTS -- ALMOST ONE A WEEK. SCHOOL WAS CRAPPY, WITH A LOT OF CHILDREN EXPOSED TO MARIJUANA SCENTS DUE TO COLLEGE HOUSING. STREETS WERE DIRTY, HOUSES WERE EXPENSIVE, DRIVERS ARE UNFRIENDLY.
MAKE SURE TO LOCK THE DOORS AND WINDOWS IF YOU ARE GOING TO BE AWAY FOR MORE THAN A DAY OTHERWISE YOUR HOUSE WILL BE BROKEN INTO.
Rankings for New Brunswick in New Jersey


Locations Around New Brunswick
Map Of New Brunswick, NJ
Best Places Around New Brunswick
Martinsville, NJ
Population 12,370
Bradley Gardens, NJ
Population 14,345
Westfield, NJ
Population 30,839
Green Knoll, NJ
Population 6,635
Middlesex, NJ
Population 14,525
Mountainside, NJ
Population 6,991
Twin Rivers, NJ
Population 8,144
Bernardsville, NJ
Population 7,888
New Providence, NJ
Population 13,595
Colonia, NJ
Population 18,581
New Brunswick Demographics And Statistics
Population over time in New Brunswick
The current population in New Brunswick is 55,718. The population has increased 3.3% from 2010.
| Year | Population | % Change |
|---|---|---|
| 2022 | 55,718 | -0.7% |
| 2021 | 56,084 | -1.2% |
| 2020 | 56,792 | 0.6% |
| 2019 | 56,427 | 0.2% |
| 2018 | 56,338 | 1.0% |
| 2017 | 55,804 | 1.0% |
| 2016 | 55,275 | 0.2% |
| 2015 | 55,151 | 1.2% |
| 2014 | 54,500 | 1.1% |
| 2013 | 53,933 | - |
Race / Ethnicity in New Brunswick
New Brunswick is:
27.4% White with 15,277 White residents.
13.8% African American with 7,706 African American residents.
0.0% American Indian with 0 American Indian residents.
8.8% Asian with 4,912 Asian residents.
0.0% Hawaiian with 0 Hawaiian residents.
1.3% Other with 699 Other residents.
1.8% Two Or More with 1,006 Two Or More residents.
46.9% Hispanic with 26,118 Hispanic residents.
| Race | New Brunswick | NJ | USA |
|---|---|---|---|
| White | 27.4% | 53.0% | 58.9% |
| African American | 13.8% | 12.4% | 12.1% |
| American Indian | 0.0% | 0.1% | 0.6% |
| Asian | 8.8% | 9.8% | 5.7% |
| Hawaiian | 0.0% | 0.0% | 0.2% |
| Other | 1.3% | 0.7% | 0.4% |
| Two Or More | 1.8% | 2.8% | 3.5% |
| Hispanic | 46.9% | 21.2% | 18.7% |
Gender in New Brunswick
New Brunswick is 47.7% female with 26,605 female residents.
New Brunswick is 52.3% male with 29,112 male residents.
| Gender | New Brunswick | NJ | USA |
|---|---|---|---|
| Female | 47.7% | 50.7% | 50.4% |
| Male | 52.3% | 49.3% | 49.6% |
Highest level of educational attainment in New Brunswick for adults over 25
23.0% of adults in New Brunswick completed < 9th grade.
11.0% of adults in New Brunswick completed 9-12th grade.
27.0% of adults in New Brunswick completed high school / ged.
11.0% of adults in New Brunswick completed some college.
4.0% of adults in New Brunswick completed associate's degree.
13.0% of adults in New Brunswick completed bachelor's degree.
6.0% of adults in New Brunswick completed master's degree.
3.0% of adults in New Brunswick completed professional degree.
2.0% of adults in New Brunswick completed doctorate degree.
| Education | New Brunswick | NJ | USA |
|---|---|---|---|
| < 9th Grade | 23.0% | 4.0% | 4.0% |
| 9-12th Grade | 11.0% | 5.0% | 6.0% |
| High School / GED | 27.0% | 26.0% | 26.0% |
| Some College | 11.0% | 16.0% | 20.0% |
| Associate's Degree | 4.0% | 7.0% | 9.0% |
| Bachelor's Degree | 13.0% | 25.0% | 21.0% |
| Master's Degree | 6.0% | 12.0% | 10.0% |
| Professional Degree | 3.0% | 3.0% | 2.0% |
| Doctorate Degree | 2.0% | 2.0% | 2.0% |
Household Income For New Brunswick, New Jersey
11.5% of households in New Brunswick earn Less than $10,000.
5.8% of households in New Brunswick earn $10,000 to $14,999.
10.9% of households in New Brunswick earn $15,000 to $24,999.
8.3% of households in New Brunswick earn $25,000 to $34,999.
8.7% of households in New Brunswick earn $35,000 to $49,999.
14.6% of households in New Brunswick earn $50,000 to $74,999.
10.0% of households in New Brunswick earn $75,000 to $99,999.
15.1% of households in New Brunswick earn $100,000 to $149,999.
7.6% of households in New Brunswick earn $150,000 to $199,999.
7.4% of households in New Brunswick earn $200,000 or more.
| Income | New Brunswick | NJ | USA |
|---|---|---|---|
| Less than $10,000 | 11.5% | 4.1% | 4.9% |
| $10,000 to $14,999 | 5.8% | 3.0% | 3.8% |
| $15,000 to $24,999 | 10.9% | 5.4% | 7.0% |
| $25,000 to $34,999 | 8.3% | 5.7% | 7.4% |
| $35,000 to $49,999 | 8.7% | 8.2% | 10.7% |
| $50,000 to $74,999 | 14.6% | 13.2% | 16.1% |
| $75,000 to $99,999 | 10.0% | 11.6% | 12.8% |
| $100,000 to $149,999 | 15.1% | 18.0% | 17.1% |
| $150,000 to $199,999 | 7.6% | 11.5% | 8.8% |
| $200,000 or more | 7.4% | 19.2% | 11.4% |


