Rye, NY
Demographics And Statistics
Living In Rye, New York Summary
Life in Rye research summary. HomeSnacks has been using Saturday Night Science to research the quality of life in Rye over the past nine years using Census, FBI, Zillow, and other primary data sources. Based on the most recently available data, we found the following about life in Rye:
The population in Rye is 16,447.
The median home value in Rye is $2,034,669.
The median income in Rye is $227,565.
The cost of living in Rye is 227 which is 2.3x higher than the national average.
The median rent in Rye is $2,468.
The unemployment rate in Rye is 5.2%.
The poverty rate in Rye is 2.9%.
The average high in Rye is 61.9° and the average low is 45.4°.
Rye SnackAbility
Overall SnackAbility
Rye, NY Crime Report
Crime in Rye summary. We use data from the FBI to determine the crime rates in Rye. Key points include:
There were 25 total crimes in Rye in the last reporting year.
The overall crime rate per 100,000 people in Rye is 153.9 / 100k people.
The violent crime rate per 100,000 people in Rye is 0.0 / 100k people.
The property crime rate per 100,000 people in Rye is 153.9 / 100k people.
Overall, crime in Rye is -93.38% below the national average.
Total Crimes
Below National Average
Crime In Rye Comparison Table
| Statistic | Count Raw |
Rye / 100k People |
New York / 100k People |
National / 100k People |
|---|---|---|---|---|
| Total Crimes Per 100K | 25 | 153.9 | 1,774.5 | 2,324.2 |
| Violent Crime | 0 | 0.0 | 363.8 | 369.8 |
| Murder | 0 | 0.0 | 4.2 | 6.3 |
| Robbery | 0 | 0.0 | 90.6 | 66.1 |
| Aggravated Assault | 0 | 0.0 | 240.7 | 268.2 |
| Property Crime | 25 | 153.9 | 1,410.7 | 1,954.4 |
| Burglary | 3 | 18.5 | 165.5 | 269.8 |
| Larceny | 14 | 86.2 | 1,143.6 | 1,401.9 |
| Car Theft | 8 | 49.3 | 101.7 | 282.7 |
Rye, NY Cost Of Living
Cost of living in Rye summary. We use data on the cost of living to determine how expensive it is to live in Rye. Real estate prices drive most of the variance in cost of living around New York. Key points include:
The cost of living in Rye is 227 with 100 being average.
The cost of living in Rye is 2.3x higher than the national average.
The median home value in Rye is $2,034,669.
The median income in Rye is $227,565.
Rye's Overall Cost Of Living
Higher Than The National Average
Cost Of Living In Rye Comparison Table
| Living Expense | Rye | New York | National Average | |
|---|---|---|---|---|
| Overall | 227 | 126 | 100 | |
| Services | 121 | 110 | 100 | |
| Groceries | 108 | 104 | 100 | |
| Health | 108 | 105 | 100 | |
| Housing | 485 | 175 | 100 | |
| Transportation | 114 | 107 | 100 | |
| Utilities | 134 | 102 | 100 | |
Rye, NY Weather
The average high in Rye is 61.9° and the average low is 45.4°.
There are 76.2 days of precipitation each year.
Expect an average of 48.1 inches of precipitation each year with 29.3 inches of snow.
| Stat | Rye |
|---|---|
| Average Annual High | 61.9 |
| Average Annual Low | 45.4 |
| Annual Precipitation Days | 76.2 |
| Average Annual Precipitation | 48.1 |
| Average Annual Snowfall | 29.3 |
Average High
Days of Rain
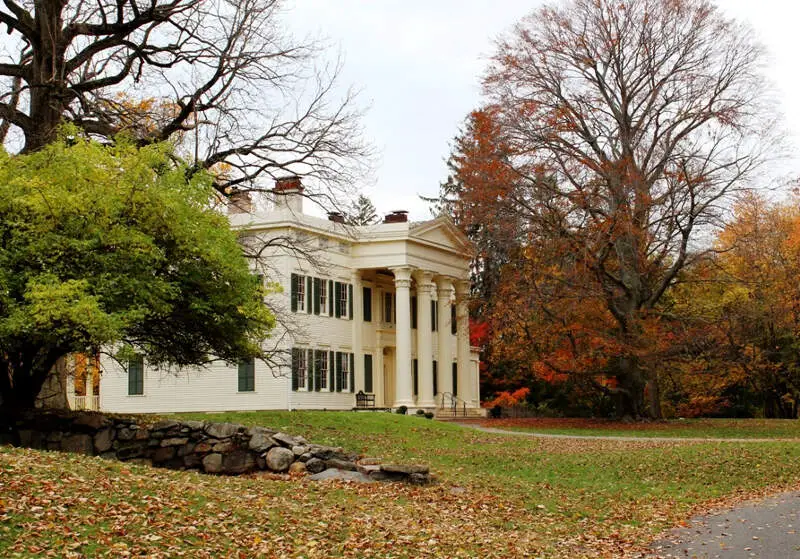
Rye, NY Photos

Rankings for Rye in New York


Locations Around Rye
Map Of Rye, NY
Best Places Around Rye
Malverne, NY
Population 8,526
Plainview, NY
Population 26,620
Syosset, NY
Population 18,807
Bronxville, NY
Population 6,570
Pelham Manor, NY
Population 5,682
Levittown, NY
Population 50,804
North New Hyde Park, NY
Population 14,652
Plainedge, NY
Population 8,963
Jericho, NY
Population 14,281
North Bellmore, NY
Population 21,070
Rye Demographics And Statistics
Population over time in Rye
The current population in Rye is 16,447. The population has increased 6.1% from 2010.
| Year | Population | % Change |
|---|---|---|
| 2022 | 16,447 | 3.7% |
| 2021 | 15,862 | -0.9% |
| 2020 | 16,004 | 0.3% |
| 2019 | 15,949 | 0.0% |
| 2018 | 15,944 | 0.3% |
| 2017 | 15,892 | 0.6% |
| 2016 | 15,805 | 0.6% |
| 2015 | 15,713 | 0.6% |
| 2014 | 15,619 | 0.8% |
| 2013 | 15,497 | - |
Race / Ethnicity in Rye
Rye is:
76.7% White with 12,609 White residents.
1.6% African American with 264 African American residents.
0.1% American Indian with 21 American Indian residents.
7.4% Asian with 1,223 Asian residents.
0.0% Hawaiian with 0 Hawaiian residents.
1.7% Other with 279 Other residents.
4.8% Two Or More with 792 Two Or More residents.
7.7% Hispanic with 1,259 Hispanic residents.
| Race | Rye | NY | USA |
|---|---|---|---|
| White | 76.7% | 53.8% | 58.9% |
| African American | 1.6% | 13.8% | 12.1% |
| American Indian | 0.1% | 0.2% | 0.6% |
| Asian | 7.4% | 8.8% | 5.7% |
| Hawaiian | 0.0% | 0.0% | 0.2% |
| Other | 1.7% | 0.8% | 0.4% |
| Two Or More | 4.8% | 3.1% | 3.5% |
| Hispanic | 7.7% | 19.5% | 18.7% |
Gender in Rye
Rye is 50.2% female with 8,259 female residents.
Rye is 49.8% male with 8,187 male residents.
| Gender | Rye | NY | USA |
|---|---|---|---|
| Female | 50.2% | 51.1% | 50.4% |
| Male | 49.8% | 48.9% | 49.6% |
Highest level of educational attainment in Rye for adults over 25
1.0% of adults in Rye completed < 9th grade.
1.0% of adults in Rye completed 9-12th grade.
6.0% of adults in Rye completed high school / ged.
6.0% of adults in Rye completed some college.
4.0% of adults in Rye completed associate's degree.
35.0% of adults in Rye completed bachelor's degree.
30.0% of adults in Rye completed master's degree.
14.0% of adults in Rye completed professional degree.
3.0% of adults in Rye completed doctorate degree.
| Education | Rye | NY | USA |
|---|---|---|---|
| < 9th Grade | 1.0% | 6.0% | 4.0% |
| 9-12th Grade | 1.0% | 6.0% | 6.0% |
| High School / GED | 6.0% | 25.0% | 26.0% |
| Some College | 6.0% | 15.0% | 20.0% |
| Associate's Degree | 4.0% | 9.0% | 9.0% |
| Bachelor's Degree | 35.0% | 22.0% | 21.0% |
| Master's Degree | 30.0% | 12.0% | 10.0% |
| Professional Degree | 14.0% | 3.0% | 2.0% |
| Doctorate Degree | 3.0% | 2.0% | 2.0% |
Household Income For Rye, New York
2.2% of households in Rye earn Less than $10,000.
0.6% of households in Rye earn $10,000 to $14,999.
3.0% of households in Rye earn $15,000 to $24,999.
2.1% of households in Rye earn $25,000 to $34,999.
3.9% of households in Rye earn $35,000 to $49,999.
5.1% of households in Rye earn $50,000 to $74,999.
5.3% of households in Rye earn $75,000 to $99,999.
12.0% of households in Rye earn $100,000 to $149,999.
11.0% of households in Rye earn $150,000 to $199,999.
54.7% of households in Rye earn $200,000 or more.
| Income | Rye | NY | USA |
|---|---|---|---|
| Less than $10,000 | 2.2% | 5.6% | 4.9% |
| $10,000 to $14,999 | 0.6% | 4.3% | 3.8% |
| $15,000 to $24,999 | 3.0% | 6.9% | 7.0% |
| $25,000 to $34,999 | 2.1% | 6.6% | 7.4% |
| $35,000 to $49,999 | 3.9% | 9.3% | 10.7% |
| $50,000 to $74,999 | 5.1% | 14.1% | 16.1% |
| $75,000 to $99,999 | 5.3% | 11.5% | 12.8% |
| $100,000 to $149,999 | 12.0% | 16.8% | 17.1% |
| $150,000 to $199,999 | 11.0% | 9.7% | 8.8% |
| $200,000 or more | 54.7% | 15.2% | 11.4% |


