Sleepy Hollow, NY
Demographics And Statistics
Living In Sleepy Hollow, New York Summary
Life in Sleepy Hollow research summary. HomeSnacks has been using Saturday Night Science to research the quality of life in Sleepy Hollow over the past nine years using Census, FBI, Zillow, and other primary data sources. Based on the most recently available data, we found the following about life in Sleepy Hollow:
The population in Sleepy Hollow is 10,396.
The median home value in Sleepy Hollow is $897,889.
The median income in Sleepy Hollow is $98,580.
The cost of living in Sleepy Hollow is 161 which is 1.6x higher than the national average.
The median rent in Sleepy Hollow is $1,710.
The unemployment rate in Sleepy Hollow is 8.2%.
The poverty rate in Sleepy Hollow is 10.0%.
The average high in Sleepy Hollow is 61.5° and the average low is 43.4°.
Table Of Contents
Sleepy Hollow SnackAbility
Overall SnackAbility
Sleepy Hollow, NY Cost Of Living
Cost of living in Sleepy Hollow summary. We use data on the cost of living to determine how expensive it is to live in Sleepy Hollow. Real estate prices drive most of the variance in cost of living around New York. Key points include:
The cost of living in Sleepy Hollow is 161 with 100 being average.
The cost of living in Sleepy Hollow is 1.6x higher than the national average.
The median home value in Sleepy Hollow is $897,889.
The median income in Sleepy Hollow is $98,580.
Sleepy Hollow's Overall Cost Of Living
Higher Than The National Average
Cost Of Living In Sleepy Hollow Comparison Table
| Living Expense | Sleepy Hollow | New York | National Average | |
|---|---|---|---|---|
| Overall | 161 | 126 | 100 | |
| Services | 120 | 110 | 100 | |
| Groceries | 108 | 104 | 100 | |
| Health | 106 | 105 | 100 | |
| Housing | 271 | 175 | 100 | |
| Transportation | 114 | 107 | 100 | |
| Utilities | 134 | 102 | 100 | |
Sleepy Hollow, NY Weather
The average high in Sleepy Hollow is 61.5° and the average low is 43.4°.
There are 80.5 days of precipitation each year.
Expect an average of 48.7 inches of precipitation each year with 32.9 inches of snow.
| Stat | Sleepy Hollow |
|---|---|
| Average Annual High | 61.5 |
| Average Annual Low | 43.4 |
| Annual Precipitation Days | 80.5 |
| Average Annual Precipitation | 48.7 |
| Average Annual Snowfall | 32.9 |
Average High
Days of Rain
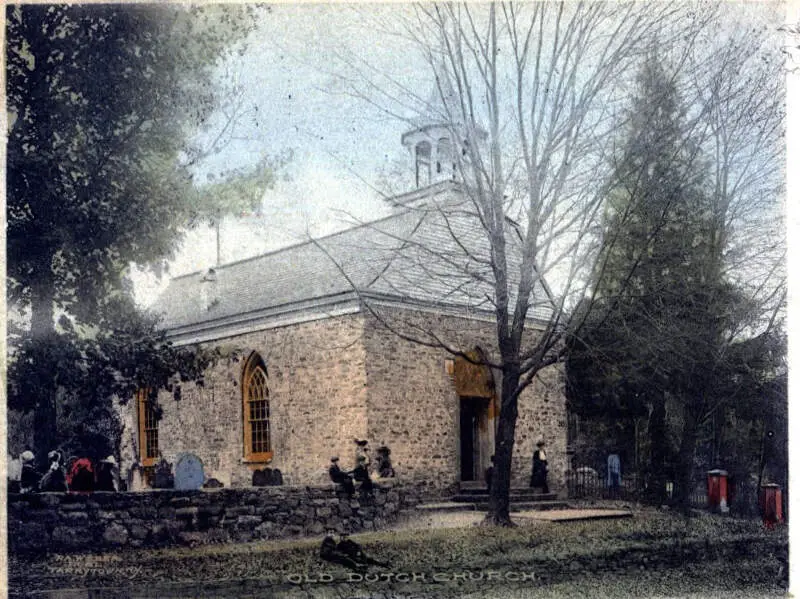
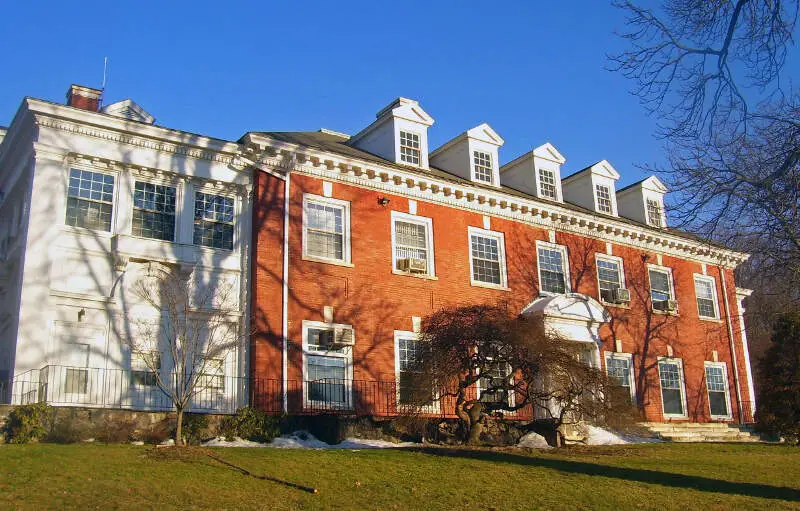
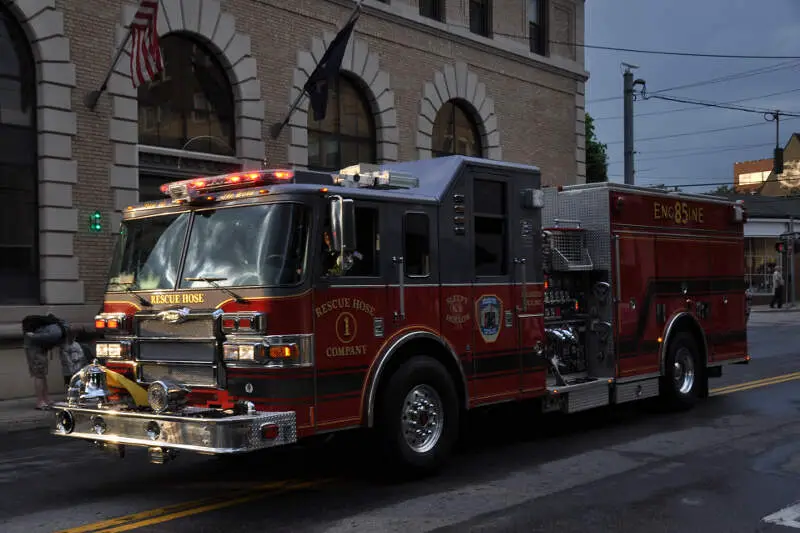
Sleepy Hollow, NY Photos

Rankings for Sleepy Hollow in New York


Locations Around Sleepy Hollow
Map Of Sleepy Hollow, NY
Best Places Around Sleepy Hollow
Bronxville, NY
Population 6,570
Pelham Manor, NY
Population 5,682
Pleasantville, NY
Population 7,430
Larchmont, NY
Population 6,549
Briarcliff Manor, NY
Population 7,395
Tappan, NY
Population 7,016
Irvington, NY
Population 6,590
Mamaroneck, NY
Population 19,930
Blauvelt, NY
Population 5,154
Eastchester, NY
Population 20,633
Sleepy Hollow Demographics And Statistics
Population over time in Sleepy Hollow
The current population in Sleepy Hollow is 10,396. The population has increased 7.2% from 2010.
| Year | Population | % Change |
|---|---|---|
| 2022 | 10,396 | 2.5% |
| 2021 | 10,138 | -0.5% |
| 2020 | 10,190 | 0.7% |
| 2019 | 10,117 | 0.4% |
| 2018 | 10,074 | 0.7% |
| 2017 | 10,002 | 0.9% |
| 2016 | 9,914 | 0.8% |
| 2015 | 9,840 | 0.5% |
| 2014 | 9,787 | 0.9% |
| 2013 | 9,701 | - |
Race / Ethnicity in Sleepy Hollow
Sleepy Hollow is:
40.9% White with 4,255 White residents.
3.1% African American with 319 African American residents.
0.0% American Indian with 0 American Indian residents.
2.3% Asian with 241 Asian residents.
0.0% Hawaiian with 0 Hawaiian residents.
0.2% Other with 24 Other residents.
3.1% Two Or More with 327 Two Or More residents.
50.3% Hispanic with 5,230 Hispanic residents.
| Race | Sleepy Hollow | NY | USA |
|---|---|---|---|
| White | 40.9% | 53.8% | 58.9% |
| African American | 3.1% | 13.8% | 12.1% |
| American Indian | 0.0% | 0.2% | 0.6% |
| Asian | 2.3% | 8.8% | 5.7% |
| Hawaiian | 0.0% | 0.0% | 0.2% |
| Other | 0.2% | 0.8% | 0.4% |
| Two Or More | 3.1% | 3.1% | 3.5% |
| Hispanic | 50.3% | 19.5% | 18.7% |
Gender in Sleepy Hollow
Sleepy Hollow is 49.6% female with 5,156 female residents.
Sleepy Hollow is 50.4% male with 5,240 male residents.
| Gender | Sleepy Hollow | NY | USA |
|---|---|---|---|
| Female | 49.6% | 51.1% | 50.4% |
| Male | 50.4% | 48.9% | 49.6% |
Highest level of educational attainment in Sleepy Hollow for adults over 25
16.0% of adults in Sleepy Hollow completed < 9th grade.
12.0% of adults in Sleepy Hollow completed 9-12th grade.
14.0% of adults in Sleepy Hollow completed high school / ged.
15.0% of adults in Sleepy Hollow completed some college.
4.0% of adults in Sleepy Hollow completed associate's degree.
19.0% of adults in Sleepy Hollow completed bachelor's degree.
14.0% of adults in Sleepy Hollow completed master's degree.
4.0% of adults in Sleepy Hollow completed professional degree.
2.0% of adults in Sleepy Hollow completed doctorate degree.
| Education | Sleepy Hollow | NY | USA |
|---|---|---|---|
| < 9th Grade | 16.0% | 6.0% | 4.0% |
| 9-12th Grade | 12.0% | 6.0% | 6.0% |
| High School / GED | 14.0% | 25.0% | 26.0% |
| Some College | 15.0% | 15.0% | 20.0% |
| Associate's Degree | 4.0% | 9.0% | 9.0% |
| Bachelor's Degree | 19.0% | 22.0% | 21.0% |
| Master's Degree | 14.0% | 12.0% | 10.0% |
| Professional Degree | 4.0% | 3.0% | 2.0% |
| Doctorate Degree | 2.0% | 2.0% | 2.0% |
Household Income For Sleepy Hollow, New York
5.0% of households in Sleepy Hollow earn Less than $10,000.
3.5% of households in Sleepy Hollow earn $10,000 to $14,999.
8.0% of households in Sleepy Hollow earn $15,000 to $24,999.
4.9% of households in Sleepy Hollow earn $25,000 to $34,999.
6.5% of households in Sleepy Hollow earn $35,000 to $49,999.
11.4% of households in Sleepy Hollow earn $50,000 to $74,999.
15.1% of households in Sleepy Hollow earn $75,000 to $99,999.
17.8% of households in Sleepy Hollow earn $100,000 to $149,999.
8.8% of households in Sleepy Hollow earn $150,000 to $199,999.
19.2% of households in Sleepy Hollow earn $200,000 or more.
| Income | Sleepy Hollow | NY | USA |
|---|---|---|---|
| Less than $10,000 | 5.0% | 5.6% | 4.9% |
| $10,000 to $14,999 | 3.5% | 4.3% | 3.8% |
| $15,000 to $24,999 | 8.0% | 6.9% | 7.0% |
| $25,000 to $34,999 | 4.9% | 6.6% | 7.4% |
| $35,000 to $49,999 | 6.5% | 9.3% | 10.7% |
| $50,000 to $74,999 | 11.4% | 14.1% | 16.1% |
| $75,000 to $99,999 | 15.1% | 11.5% | 12.8% |
| $100,000 to $149,999 | 17.8% | 16.8% | 17.1% |
| $150,000 to $199,999 | 8.8% | 9.7% | 8.8% |
| $200,000 or more | 19.2% | 15.2% | 11.4% |


