Cleveland Heights, OH
Demographics And Statistics
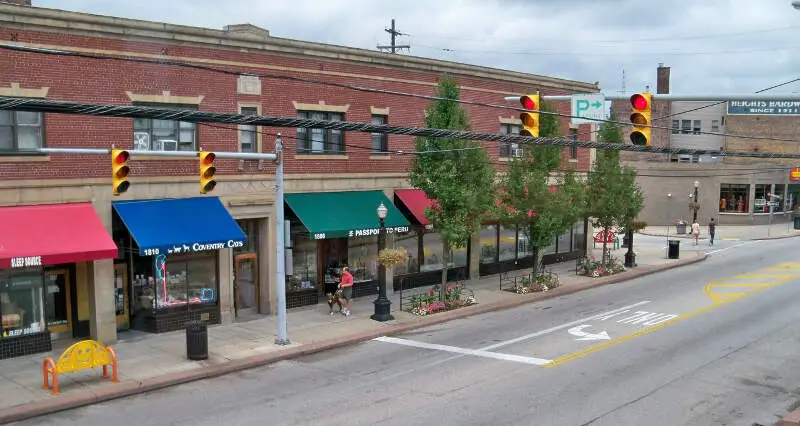
Living In Cleveland Heights, Ohio Summary
Life in Cleveland Heights research summary. HomeSnacks has been using Saturday Night Science to research the quality of life in Cleveland Heights over the past nine years using Census, FBI, Zillow, and other primary data sources. Based on the most recently available data, we found the following about life in Cleveland Heights:
The population in Cleveland Heights is 45,002.
The median home value in Cleveland Heights is $182,494.
The median income in Cleveland Heights is $69,155.
The cost of living in Cleveland Heights is 91 which is 0.9x lower than the national average.
The median rent in Cleveland Heights is $1,091.
The unemployment rate in Cleveland Heights is 7.5%.
The poverty rate in Cleveland Heights is 16.2%.
The average high in Cleveland Heights is 58.8° and the average low is 41.5°.
Cleveland Heights SnackAbility
Overall SnackAbility
Cleveland Heights, OH Crime Report
Crime in Cleveland Heights summary. We use data from the FBI to determine the crime rates in Cleveland Heights. Key points include:
There were 601 total crimes in Cleveland Heights in the last reporting year.
The overall crime rate per 100,000 people in Cleveland Heights is 1,362.7 / 100k people.
The violent crime rate per 100,000 people in Cleveland Heights is 222.2 / 100k people.
The property crime rate per 100,000 people in Cleveland Heights is 1,140.5 / 100k people.
Overall, crime in Cleveland Heights is -41.37% below the national average.
Total Crimes
Below National Average
Crime In Cleveland Heights Comparison Table
| Statistic | Count Raw |
Cleveland Heights / 100k People |
Ohio / 100k People |
National / 100k People |
|---|---|---|---|---|
| Total Crimes Per 100K | 601 | 1,362.7 | 2,159.1 | 2,324.2 |
| Violent Crime | 98 | 222.2 | 308.8 | 369.8 |
| Murder | 1 | 2.3 | 7.0 | 6.3 |
| Robbery | 32 | 72.6 | 66.9 | 66.1 |
| Aggravated Assault | 50 | 113.4 | 191.6 | 268.2 |
| Property Crime | 503 | 1,140.5 | 1,850.3 | 1,954.4 |
| Burglary | 68 | 154.2 | 318.8 | 269.8 |
| Larceny | 353 | 800.4 | 1,359.8 | 1,401.9 |
| Car Theft | 82 | 185.9 | 171.7 | 282.7 |
Cleveland Heights, OH Cost Of Living
Cost of living in Cleveland Heights summary. We use data on the cost of living to determine how expensive it is to live in Cleveland Heights. Real estate prices drive most of the variance in cost of living around Ohio. Key points include:
The cost of living in Cleveland Heights is 91 with 100 being average.
The cost of living in Cleveland Heights is 0.9x lower than the national average.
The median home value in Cleveland Heights is $182,494.
The median income in Cleveland Heights is $69,155.
Cleveland Heights's Overall Cost Of Living
Lower Than The National Average
Cost Of Living In Cleveland Heights Comparison Table
| Living Expense | Cleveland Heights | Ohio | National Average | |
|---|---|---|---|---|
| Overall | 91 | 91 | 100 | |
| Services | 96 | 98 | 100 | |
| Groceries | 107 | 101 | 100 | |
| Health | 97 | 95 | 100 | |
| Housing | 74 | 73 | 100 | |
| Transportation | 95 | 98 | 100 | |
| Utilities | 97 | 93 | 100 | |
Cleveland Heights, OH Weather
The average high in Cleveland Heights is 58.8° and the average low is 41.5°.
There are 98.6 days of precipitation each year.
Expect an average of 42.2 inches of precipitation each year with 70.4 inches of snow.
| Stat | Cleveland Heights |
|---|---|
| Average Annual High | 58.8 |
| Average Annual Low | 41.5 |
| Annual Precipitation Days | 98.6 |
| Average Annual Precipitation | 42.2 |
| Average Annual Snowfall | 70.4 |
Average High
Days of Rain
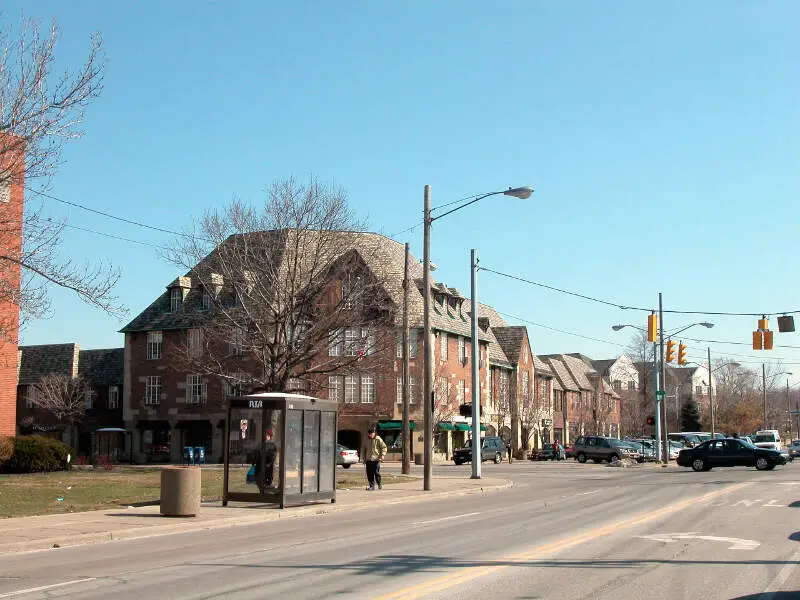
Cleveland Heights, OH Photos
Rankings for Cleveland Heights in Ohio


Locations Around Cleveland Heights
Map Of Cleveland Heights, OH
Best Places Around Cleveland Heights
Hudson, OH
Population 23,005
Shaker Heights, OH
Population 29,157
Westlake, OH
Population 34,027
Highland Heights, OH
Population 8,652
Macedonia, OH
Population 12,126
Pepper Pike, OH
Population 6,778
Solon, OH
Population 24,053
North Olmsted, OH
Population 32,244
Broadview Heights, OH
Population 19,815
Strongsville, OH
Population 46,165
Cleveland Heights Demographics And Statistics
Population over time in Cleveland Heights
The current population in Cleveland Heights is 45,002. The population has decreased -3.8% from 2010.
| Year | Population | % Change |
|---|---|---|
| 2022 | 45,002 | 0.3% |
| 2021 | 44,865 | -0.4% |
| 2020 | 45,024 | -0.3% |
| 2019 | 45,160 | -0.5% |
| 2018 | 45,388 | -0.6% |
| 2017 | 45,657 | -0.4% |
| 2016 | 45,851 | -0.4% |
| 2015 | 46,052 | -0.7% |
| 2014 | 46,384 | -0.9% |
| 2013 | 46,797 | - |
Race / Ethnicity in Cleveland Heights
Cleveland Heights is:
46.5% White with 20,912 White residents.
41.4% African American with 18,652 African American residents.
0.1% American Indian with 38 American Indian residents.
5.3% Asian with 2,398 Asian residents.
0.1% Hawaiian with 47 Hawaiian residents.
0.8% Other with 374 Other residents.
3.0% Two Or More with 1,352 Two Or More residents.
2.7% Hispanic with 1,229 Hispanic residents.
| Race | Cleveland Heights | OH | USA |
|---|---|---|---|
| White | 46.5% | 77.2% | 58.9% |
| African American | 41.4% | 12.2% | 12.1% |
| American Indian | 0.1% | 0.1% | 0.6% |
| Asian | 5.3% | 2.4% | 5.7% |
| Hawaiian | 0.1% | 0.0% | 0.2% |
| Other | 0.8% | 0.3% | 0.4% |
| Two Or More | 3.0% | 3.6% | 3.5% |
| Hispanic | 2.7% | 4.2% | 18.7% |
Gender in Cleveland Heights
Cleveland Heights is 54.4% female with 24,481 female residents.
Cleveland Heights is 45.6% male with 20,521 male residents.
| Gender | Cleveland Heights | OH | USA |
|---|---|---|---|
| Female | 54.4% | 50.6% | 50.4% |
| Male | 45.6% | 49.4% | 49.6% |
Highest level of educational attainment in Cleveland Heights for adults over 25
2.0% of adults in Cleveland Heights completed < 9th grade.
3.0% of adults in Cleveland Heights completed 9-12th grade.
15.0% of adults in Cleveland Heights completed high school / ged.
16.0% of adults in Cleveland Heights completed some college.
7.0% of adults in Cleveland Heights completed associate's degree.
26.0% of adults in Cleveland Heights completed bachelor's degree.
18.0% of adults in Cleveland Heights completed master's degree.
7.0% of adults in Cleveland Heights completed professional degree.
6.0% of adults in Cleveland Heights completed doctorate degree.
| Education | Cleveland Heights | OH | USA |
|---|---|---|---|
| < 9th Grade | 2.0% | 2.0% | 4.0% |
| 9-12th Grade | 3.0% | 6.0% | 6.0% |
| High School / GED | 15.0% | 32.0% | 26.0% |
| Some College | 16.0% | 20.0% | 20.0% |
| Associate's Degree | 7.0% | 9.0% | 9.0% |
| Bachelor's Degree | 26.0% | 19.0% | 21.0% |
| Master's Degree | 18.0% | 9.0% | 10.0% |
| Professional Degree | 7.0% | 2.0% | 2.0% |
| Doctorate Degree | 6.0% | 1.0% | 2.0% |
Household Income For Cleveland Heights, Ohio
6.3% of households in Cleveland Heights earn Less than $10,000.
4.5% of households in Cleveland Heights earn $10,000 to $14,999.
7.3% of households in Cleveland Heights earn $15,000 to $24,999.
7.5% of households in Cleveland Heights earn $25,000 to $34,999.
10.1% of households in Cleveland Heights earn $35,000 to $49,999.
18.7% of households in Cleveland Heights earn $50,000 to $74,999.
12.0% of households in Cleveland Heights earn $75,000 to $99,999.
16.9% of households in Cleveland Heights earn $100,000 to $149,999.
7.3% of households in Cleveland Heights earn $150,000 to $199,999.
9.5% of households in Cleveland Heights earn $200,000 or more.
| Income | Cleveland Heights | OH | USA |
|---|---|---|---|
| Less than $10,000 | 6.3% | 5.2% | 4.9% |
| $10,000 to $14,999 | 4.5% | 4.4% | 3.8% |
| $15,000 to $24,999 | 7.3% | 7.9% | 7.0% |
| $25,000 to $34,999 | 7.5% | 8.3% | 7.4% |
| $35,000 to $49,999 | 10.1% | 12.1% | 10.7% |
| $50,000 to $74,999 | 18.7% | 17.3% | 16.1% |
| $75,000 to $99,999 | 12.0% | 13.3% | 12.8% |
| $100,000 to $149,999 | 16.9% | 16.5% | 17.1% |
| $150,000 to $199,999 | 7.3% | 7.4% | 8.8% |
| $200,000 or more | 9.5% | 7.6% | 11.4% |


