100 Biggest Cities In Ohio For 2023
Using the latest Census data, we detail the 100 biggest cities in Ohio. You can all see a comprehensive list of all 672 cities and places in Ohio.

We all love the biggest cities that the Buckeye State has to offer. You know the places like Columbus and Cleveland which make all the headlines.
But there are a bunch of other great large cities in Ohio that don't get as much love.
We're going to change that right now.
Using the most recent Census data, we can tell you about all the places in Ohio with a focus on the biggest. We update the data each year and this is our fourth time doing this.
Table Of Contents: Top Ten | Methodology | Table
The Largest Cities In Ohio For 2023:
You can click here to see a full table of the full of the 100 biggest cities in Ohio, along with every other place over 1,000 people big. It is sortable by clicking on the headers.
Read on below to see more on the biggest cities. Or for more reading on places to live in Ohio, check out:
The 10 Biggest Cities In Ohio
/10
Rank Last Year: 1 (No Change)
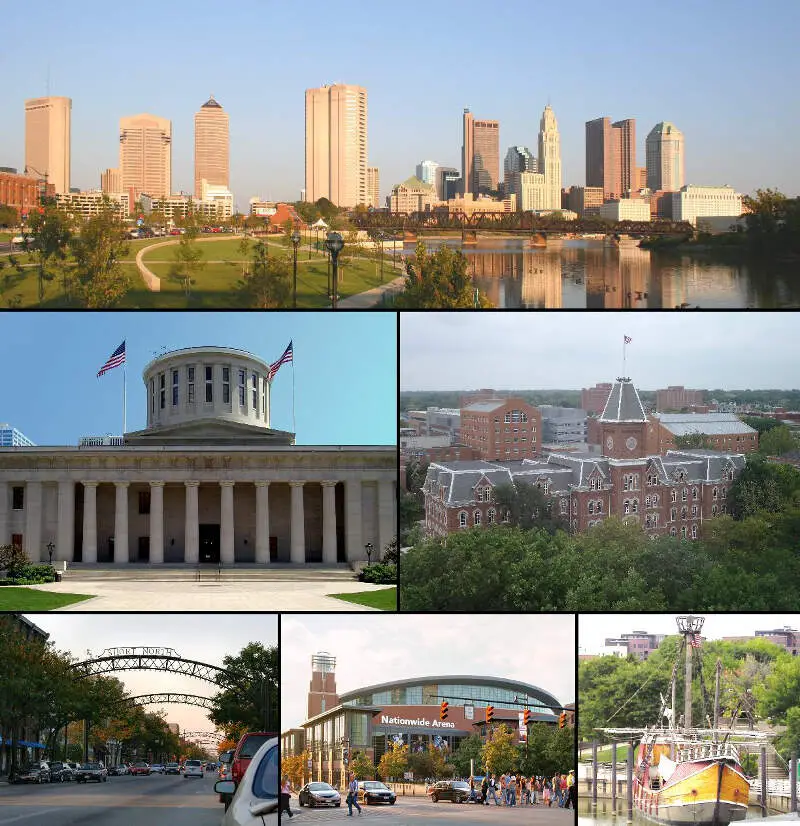
Population: 898,143
Population 2010: 770,407
Growth: 16.6%
More on Columbus: Data | Crime | Cost Of Living | Real Estate
/10
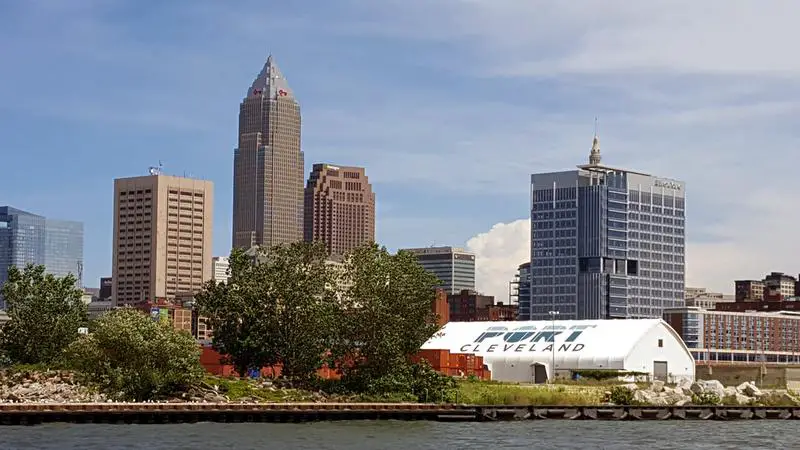
Rank Last Year: 2 (No Change)
Population: 374,861
Population 2010: 409,221
Growth: -8.4%
More on Cleveland: Data | Crime | Cost Of Living | Real Estate
/10
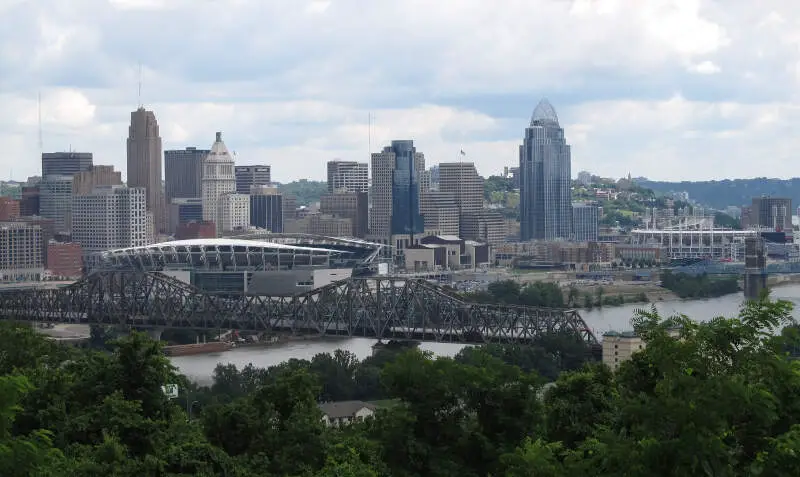
Rank Last Year: 3 (No Change)
Population: 308,664
Population 2010: 300,165
Growth: 2.8%
More on Cincinnati: Data | Crime | Cost Of Living | Real Estate
/10
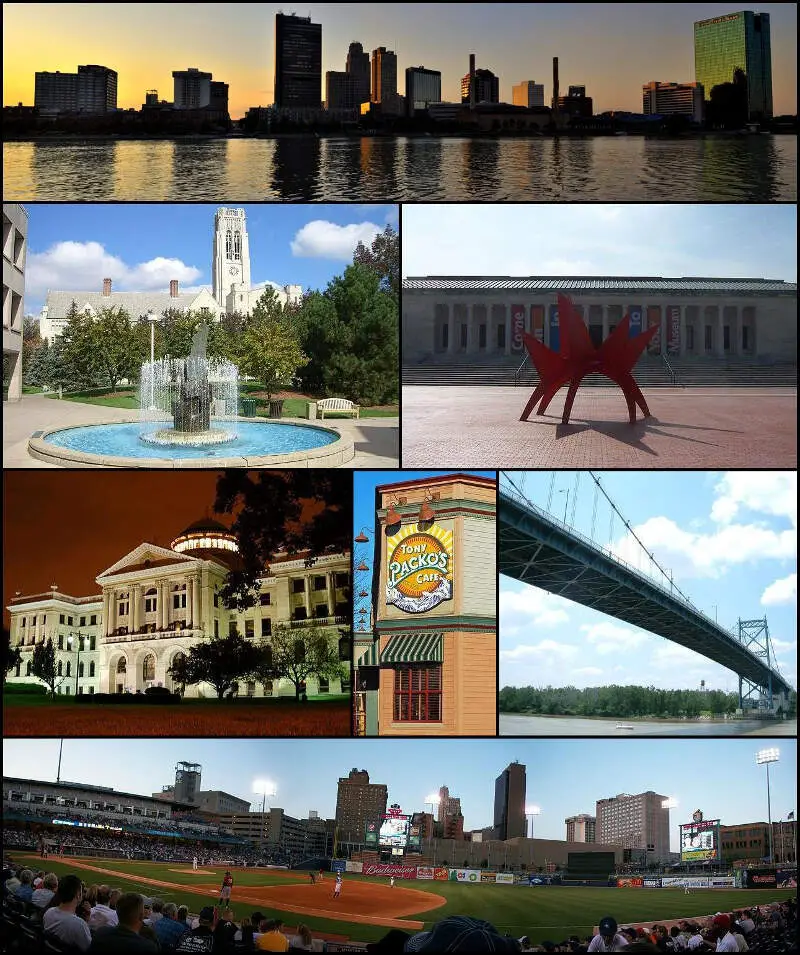
Rank Last Year: 4 (No Change)
Population: 271,454
Population 2010: 291,851
Growth: -7.0%
More on Toledo: Data | Crime | Cost Of Living | Real Estate
/10
Rank Last Year: 5 (No Change)
Population: 191,483
Population 2010: 202,814
Growth: -5.6%
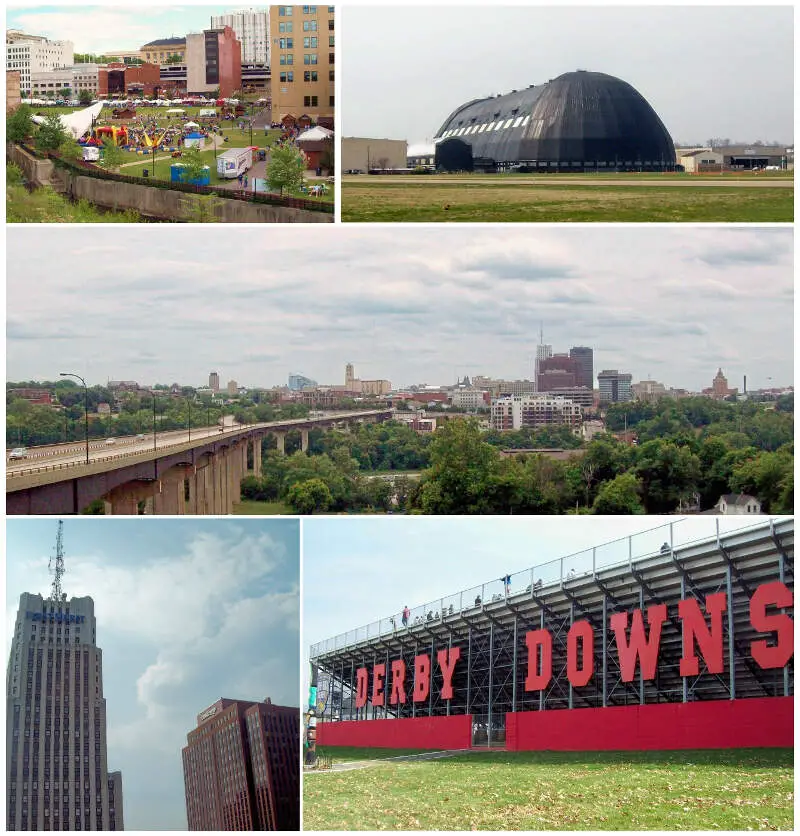
More on Akron: Data | Crime | Cost Of Living | Real Estate
/10
Rank Last Year: 6 (No Change)
Population: 138,416
Population 2010: 145,609
Growth: -4.9%
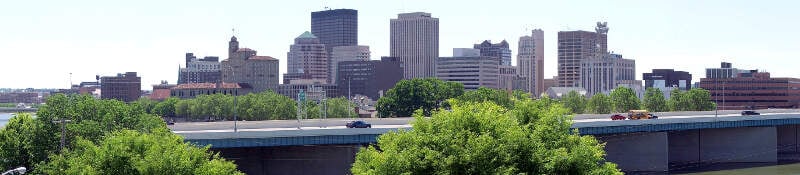
More on Dayton: Data | Crime | Cost Of Living | Real Estate
/10
Rank Last Year: 7 (No Change)
Population: 80,880
Population 2010: 81,894
Growth: -1.2%
More on Parma: Data | Crime | Cost Of Living | Real Estate
/10
Rank Last Year: 8 (No Change)
Population: 71,097
Population 2010: 74,451
Growth: -4.5%
More on Canton: Data | Crime | Cost Of Living | Real Estate
/10
Rank Last Year: 10 (Up 1)
Population: 65,051
Population 2010: 65,221
Growth: -0.3%
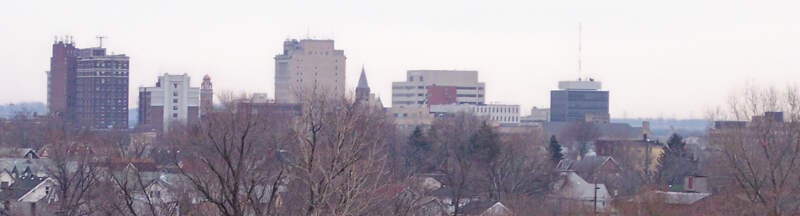
More on Lorain: Data | Crime | Cost Of Living | Real Estate
/10
Rank Last Year: 11 (Up 1)
Population: 63,127
Population 2010: 62,466
Growth: 1.1%
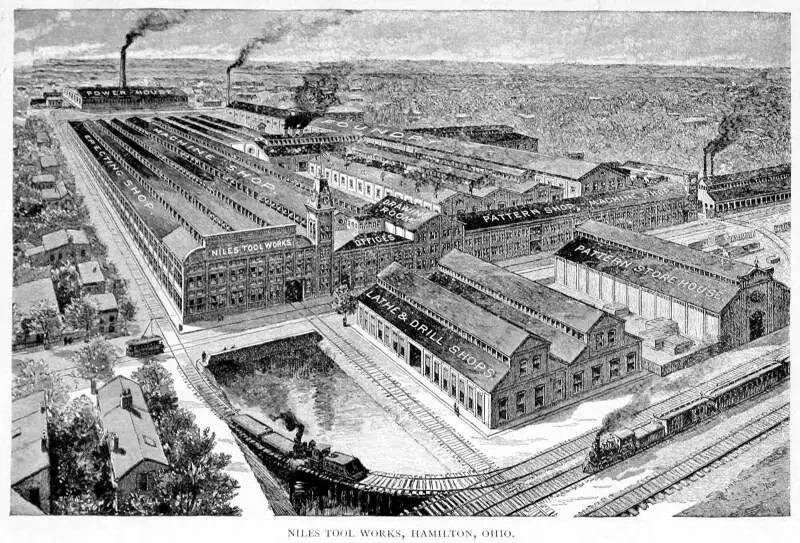
More on Hamilton: Data | Crime | Cost Of Living | Real Estate
How We Determined The Largest Cities In Ohio
We've been ranking and dissecting cities in the Buckeye State for over 4 years now -- making this actually the fourth time we've run the numbers. We always use the best data, the US Census. In this case, that means we are using the American Community Survey.
It what is probably the most simple analysis we run each year, we ranked every place in Ohio from biggest to smallest. The biggest city this year? That would be Columbus.
The smallest? Williamsport, although there are places smaller than 1,000 people not listed here, so keep that in mind as we take a look at the top ten.
Now on to numbers 11-100 Biggest in Ohio
We hope that you find the big city, or really any city, that's right for you. Below is a list of the rest of the biggest cities along with every other place in Ohio.
Have fun snacking around in the Buckeye State!
For more reading on Ohio, check out:
- Best Places To Raise A Family In Ohio
- Best Places To Retire In Ohio
- Richest Cities In Ohio
- Safest Places In Ohio
- Worst Places To Live In Ohio
- Most Expensive Places To Live In Ohio
Detailed List Of The Biggest Cities In Ohio
| Rank | City | Current Population | 2010 | Growth | |||||
|---|---|---|---|---|---|---|---|---|---|
| 1 | Columbus | 898,143 | 770,407 | 16.6% | |||||
| 2 | Cleveland | 374,861 | 409,221 | -8.4% | |||||
| 3 | Cincinnati | 308,664 | 300,165 | 2.8% | |||||
| 4 | Toledo | 271,454 | 291,851 | -7.0% | |||||
| 5 | Akron | 191,483 | 202,814 | -5.6% | |||||
| 6 | Dayton | 138,416 | 145,609 | -4.9% | |||||
| 7 | Parma | 80,880 | 81,894 | -1.2% | |||||
| 8 | Canton | 71,097 | 74,451 | -4.5% | |||||
| 9 | Lorain | 65,051 | 65,221 | -0.3% | |||||
| 10 | Hamilton | 63,127 | 62,466 | 1.1% | |||||
| 11 | Youngstown | 61,274 | 69,585 | -11.9% | |||||
| 12 | Springfield | 58,992 | 61,498 | -4.1% | |||||
| 13 | Kettering | 57,503 | 56,182 | 2.4% | |||||
| 14 | Elyria | 52,853 | 55,003 | -3.9% | |||||
| 15 | Cuyahoga Falls | 50,906 | 49,710 | 2.4% | |||||
| 16 | Lakewood | 50,841 | 52,674 | -3.5% | |||||
| 17 | Middletown | 50,114 | 48,944 | 2.4% | |||||
| 18 | Newark | 49,703 | 47,605 | 4.4% | |||||
| 19 | Euclid | 49,382 | 49,338 | 0.1% | |||||
| 20 | Dublin | 48,613 | 39,245 | 23.9% | |||||
| 21 | Mansfield | 47,437 | 48,799 | -2.8% | |||||
| 22 | Mentor | 47,369 | 47,637 | -0.6% | |||||
| 23 | Beavercreek | 46,320 | 44,064 | 5.1% | |||||
| 24 | Strongsville | 46,187 | 44,360 | 4.1% | |||||
| 25 | Cleveland Heights | 45,267 | 46,797 | -3.3% | |||||
| 26 | Fairfield | 44,550 | 42,634 | 4.5% | |||||
| 27 | Huber Heights | 42,650 | 37,837 | 12.7% | |||||
| 28 | Grove City | 41,025 | 33,947 | 20.9% | |||||
| 29 | Delaware | 41,004 | 33,672 | 21.8% | |||||
| 30 | Lancaster | 40,360 | 38,657 | 4.4% | |||||
| 31 | Findlay | 40,323 | 41,189 | -2.1% | |||||
| 32 | Reynoldsburg | 39,803 | 34,974 | 13.8% | |||||
| 33 | Warren | 39,334 | 42,667 | -7.8% | |||||
| 34 | Westerville | 38,960 | 35,970 | 8.3% | |||||
| 35 | Upper Arlington | 36,566 | 33,645 | 8.7% | |||||
| 36 | Lima | 36,352 | 38,902 | -6.6% | |||||
| 37 | Marion | 36,053 | 37,092 | -2.8% | |||||
| 38 | Gahanna | 35,626 | 32,590 | 9.3% | |||||
| 39 | Hilliard | 35,530 | 27,505 | 29.2% | |||||
| 40 | Brunswick | 35,272 | 34,406 | 2.5% | |||||
| 41 | North Ridgeville | 34,883 | 28,303 | 23.2% | |||||
| 42 | Stow | 34,556 | 34,476 | 0.2% | |||||
| 43 | Fairborn | 34,398 | 32,156 | 7.0% | |||||
| 44 | Mason | 34,337 | 29,862 | 15.0% | |||||
| 45 | Westlake | 34,049 | 32,350 | 5.3% | |||||
| 46 | North Olmsted | 32,371 | 32,792 | -1.3% | |||||
| 47 | Massillon | 32,199 | 32,020 | 0.6% | |||||
| 48 | North Royalton | 31,150 | 29,965 | 4.0% | |||||
| 49 | Bowling Green | 30,715 | 30,211 | 1.7% | |||||
| 50 | Austintown | 30,179 | 30,240 | -0.2% | |||||
| 51 | Garfield Heights | 29,585 | 29,058 | 1.8% | |||||
| 52 | Shaker Heights | 29,197 | 28,458 | 2.6% | |||||
| 53 | Kent | 27,912 | 28,845 | -3.2% | |||||
| 54 | Green | 27,267 | 25,224 | 8.1% | |||||
| 55 | Wooster | 26,753 | 26,097 | 2.5% | |||||
| 56 | Troy | 26,093 | 24,828 | 5.1% | |||||
| 57 | Medina | 26,011 | 26,657 | -2.4% | |||||
| 58 | Xenia | 25,411 | 25,592 | -0.7% | |||||
| 59 | Barberton | 25,309 | 26,842 | -5.7% | |||||
| 60 | Sandusky | 25,066 | 26,147 | -4.1% | |||||
| 61 | Avon Lake | 25,005 | 21,882 | 14.3% | |||||
| 62 | Marysville | 24,922 | 21,296 | 17.0% | |||||
| 63 | Zanesville | 24,809 | 25,567 | -3.0% | |||||
| 64 | Perrysburg | 24,633 | 20,264 | 21.6% | |||||
| 65 | Avon | 24,542 | 19,514 | 25.8% | |||||
| 66 | Athens | 24,507 | 23,484 | 4.4% | |||||
| 67 | Riverside | 24,472 | 25,511 | -4.1% | |||||
| 68 | Centerville | 24,281 | 23,838 | 1.9% | |||||
| 69 | Solon | 24,070 | 22,983 | 4.7% | |||||
| 70 | Wadsworth | 23,789 | 21,211 | 12.2% | |||||
| 71 | Willoughby | 23,753 | 22,238 | 6.8% | |||||
| 72 | Maple Heights | 23,511 | 23,575 | -0.3% | |||||
| 73 | Trotwood | 23,157 | 24,904 | -7.0% | |||||
| 74 | Hudson | 23,001 | 22,331 | 3.0% | |||||
| 75 | Oxford | 22,783 | 21,532 | 5.8% | |||||
| 76 | Pickerington | 22,682 | 17,003 | 33.4% | |||||
| 77 | Chillicothe | 22,047 | 21,996 | 0.2% | |||||
| 78 | South Euclid | 21,882 | 22,327 | -2.0% | |||||
| 79 | Alliance | 21,864 | 22,545 | -3.0% | |||||
| 80 | Rocky River | 21,515 | 20,196 | 6.5% | |||||
| 81 | Lebanon | 20,770 | 19,943 | 4.1% | |||||
| 82 | Parma Heights | 20,764 | 20,784 | -0.1% | |||||
| 83 | Sidney | 20,559 | 21,047 | -2.3% | |||||
| 84 | Piqua | 20,352 | 20,659 | -1.5% | |||||
| 85 | Painesville | 20,311 | 19,191 | 5.8% | |||||
| 86 | Mayfield Heights | 20,113 | 19,109 | 5.3% | |||||
| 87 | Whitehall | 20,004 | 18,169 | 10.1% | |||||
| 88 | Forest Park | 19,940 | 18,642 | 7.0% | |||||
| 89 | Oregon | 19,935 | 20,118 | -0.9% | |||||
| 90 | Miamisburg | 19,878 | 19,986 | -0.5% | |||||
| 91 | Broadview Heights | 19,820 | 18,674 | 6.1% | |||||
| 92 | Ashland | 19,544 | 20,648 | -5.3% | |||||
| 93 | Twinsburg | 19,220 | 18,512 | 3.8% | |||||
| 94 | White Oak | 19,123 | 19,041 | 0.4% | |||||
| 95 | Sylvania | 18,991 | 18,989 | 0.0% | |||||
| 96 | Norwood | 18,983 | 19,463 | -2.5% | |||||
| 97 | Springboro | 18,831 | 17,072 | 10.3% | |||||
| 98 | Berea | 18,724 | 18,981 | -1.4% | |||||
| 99 | Brook Park | 18,592 | 19,472 | -4.5% | |||||
| 100 | Tallmadge | 18,409 | 17,349 | 6.1% | |||||
| 101 | Portsmouth | 18,369 | 20,244 | -9.3% | |||||
| 102 | Niles | 18,319 | 19,464 | -5.9% | |||||
| 103 | Steubenville | 18,122 | 18,578 | -2.5% | |||||
| 104 | Ashtabula | 18,091 | 19,508 | -7.3% | |||||
| 105 | North Canton | 17,884 | 17,344 | 3.1% | |||||
| 106 | Tiffin | 17,882 | 17,937 | -0.3% | |||||
| 107 | Eastlake | 17,743 | 18,879 | -6.0% | |||||
| 108 | New Philadelphia | 17,622 | 17,292 | 1.9% | |||||
| 109 | Pataskala | 17,598 | 14,170 | 24.2% | |||||
| 110 | Streetsboro | 17,282 | 15,383 | 12.3% | |||||
| 111 | Fairview Park | 17,167 | 16,894 | 1.6% | |||||
| 112 | Defiance | 17,155 | 16,575 | 3.5% | |||||
| 113 | Aurora | 17,108 | 15,196 | 12.6% | |||||
| 114 | Norwalk | 17,048 | 17,008 | 0.2% | |||||
| 115 | Mount Vernon | 16,885 | 16,864 | 0.1% | |||||
| 116 | Bay Village | 16,051 | 15,647 | 2.6% | |||||
| 117 | Middleburg Heights | 15,975 | 15,798 | 1.1% | |||||
| 118 | Fremont | 15,954 | 16,959 | -5.9% | |||||
| 119 | Monroe | 15,560 | 11,868 | 31.1% | |||||
| 120 | Vandalia | 15,155 | 15,095 | 0.4% | |||||
| 121 | Worthington | 15,047 | 13,779 | 9.2% | |||||
| 122 | Washington Court House | 14,440 | 14,077 | 2.6% | |||||
| 123 | East Cleveland | 14,212 | 19,426 | -26.8% | |||||
| 124 | Willowick | 14,173 | 14,209 | -0.3% | |||||
| 125 | Sharonville | 14,022 | 13,311 | 5.3% | |||||
| 126 | Lyndhurst | 13,980 | 14,144 | -1.2% | |||||
| 127 | University Heights | 13,950 | 13,573 | 2.8% | |||||
| 128 | Circleville | 13,933 | 13,358 | 4.3% | |||||
| 129 | Maumee | 13,915 | 14,419 | -3.5% | |||||
| 130 | New Franklin | 13,913 | 14,309 | -2.8% | |||||
| 131 | Powell | 13,879 | 10,773 | 28.8% | |||||
| 132 | Bexley | 13,820 | 13,020 | 6.1% | |||||
| 133 | Beachwood | 13,806 | 11,932 | 15.7% | |||||
| 134 | Bellefontaine | 13,792 | 13,123 | 5.1% | |||||
| 135 | Warrensville Heights | 13,694 | 13,749 | -0.4% | |||||
| 136 | Brecksville | 13,607 | 13,550 | 0.4% | |||||
| 137 | Marietta | 13,559 | 14,211 | -4.6% | |||||
| 138 | Englewood | 13,441 | 13,205 | 1.8% | |||||
| 139 | Finneytown | 13,271 | 13,023 | 1.9% | |||||
| 140 | Bridgetown | 13,257 | 14,339 | -7.5% | |||||
| 141 | Clayton | 13,246 | 13,232 | 0.1% | |||||
| 142 | Blue Ash | 13,229 | 12,059 | 9.7% | |||||
| 143 | Monfort Heights | 13,221 | 11,543 | 14.5% | |||||
| 144 | Loveland | 13,125 | 11,845 | 10.8% | |||||
| 145 | Dover | 13,083 | 12,776 | 2.4% | |||||
| 146 | Bedford | 13,073 | 13,201 | -1.0% | |||||
| 147 | West Carrollton | 13,051 | 13,241 | -1.4% | |||||
| 148 | Trenton | 12,973 | 11,354 | 14.3% | |||||
| 149 | Harrison | 12,801 | 9,394 | 36.3% | |||||
| 150 | Greenville | 12,785 | 13,267 | -3.6% | |||||
| 151 | Fostoria | 12,785 | 13,041 | -2.0% | |||||
| 152 | Wickliffe | 12,688 | 12,852 | -1.3% | |||||
| 153 | Amherst | 12,665 | 12,031 | 5.3% | |||||
| 154 | Wilmington | 12,523 | 12,640 | -0.9% | |||||
| 155 | Conneaut | 12,276 | 12,798 | -4.1% | |||||
| 156 | Macedonia | 12,083 | 10,863 | 11.2% | |||||
| 157 | Salem | 11,920 | 12,383 | -3.7% | |||||
| 158 | Norton | 11,697 | 12,008 | -2.6% | |||||
| 159 | Seven Hills | 11,696 | 11,797 | -0.9% | |||||
| 160 | Bucyrus | 11,690 | 12,506 | -6.5% | |||||
| 161 | Franklin | 11,650 | 11,962 | -2.6% | |||||
| 162 | Mack | 11,452 | 11,458 | -0.1% | |||||
| 163 | Ravenna | 11,369 | 11,773 | -3.4% | |||||
| 164 | Brooklyn | 11,291 | 11,156 | 1.2% | |||||
| 165 | Urbana | 11,166 | 11,739 | -4.9% | |||||
| 166 | Dent | 11,069 | 9,793 | 13.0% | |||||
| 167 | Coshocton | 11,051 | 11,351 | -2.6% | |||||
| 168 | Springdale | 11,024 | 11,019 | 0.0% | |||||
| 169 | Northbrook | 11,005 | 10,117 | 8.8% | |||||
| 170 | New Albany | 10,962 | 0 | nan% | |||||
| 171 | Bedford Heights | 10,942 | 10,796 | 1.4% | |||||
| 172 | Celina | 10,890 | 10,424 | 4.5% | |||||
| 173 | Montgomery | 10,796 | 10,150 | 6.4% | |||||
| 174 | Van Wert | 10,793 | 11,040 | -2.2% | |||||
| 175 | Richmond Heights | 10,748 | 10,570 | 1.7% | |||||
| 176 | Ironton | 10,647 | 11,143 | -4.5% | |||||
| 177 | Vermilion | 10,560 | 10,789 | -2.1% | |||||
| 178 | Reading | 10,525 | 10,421 | 1.0% | |||||
| 179 | Forestville | 10,485 | 10,856 | -3.4% | |||||
| 180 | Heath | 10,429 | 10,074 | 3.5% | |||||
| 181 | Galion | 10,402 | 10,679 | -2.6% | |||||
| 182 | London | 10,362 | 9,709 | 6.7% | |||||
| 183 | Tipp City | 10,202 | 9,645 | 5.8% | |||||
| 184 | Cambridge | 10,116 | 10,831 | -6.6% | |||||
| 185 | Blacklick Estates | 10,066 | 8,704 | 15.6% | |||||
| 186 | Struthers | 10,058 | 10,892 | -7.7% | |||||
| 187 | East Liverpool | 10,051 | 11,535 | -12.9% | |||||
| 188 | Willoughby Hills | 9,929 | 9,390 | 5.7% | |||||
| 189 | Wapakoneta | 9,921 | 9,896 | 0.3% | |||||
| 190 | Lincoln Village | 9,720 | 9,430 | 3.1% | |||||
| 191 | Beckett Ridge | 9,716 | 8,911 | 9.0% | |||||
| 192 | North College Hill | 9,605 | 9,436 | 1.8% | |||||
| 193 | Girard | 9,571 | 10,258 | -6.7% | |||||
| 194 | Louisville | 9,497 | 9,121 | 4.1% | |||||
| 195 | Oakwood | 9,470 | 9,188 | 3.1% | |||||
| 196 | Madeira | 9,397 | 8,674 | 8.3% | |||||
| 197 | Canal Winchester | 9,209 | 0 | nan% | |||||
| 198 | Sheffield Lake | 8,985 | 9,224 | -2.6% | |||||
| 199 | Napoleon | 8,907 | 8,501 | 4.8% | |||||
| 200 | Bainbridge | 8,833 | 3,378 | 161.5% | |||||
| 201 | Perry Heights | 8,752 | 8,651 | 1.2% | |||||
| 202 | North Madison | 8,739 | 8,999 | -2.9% | |||||
| 203 | Wyoming | 8,691 | 8,318 | 4.5% | |||||
| 204 | Olmsted Falls | 8,684 | 8,752 | -0.8% | |||||
| 205 | Cheviot | 8,683 | 8,413 | 3.2% | |||||
| 206 | Bryan | 8,668 | 8,621 | 0.5% | |||||
| 207 | Highland Heights | 8,658 | 8,245 | 5.0% | |||||
| 208 | Orrville | 8,369 | 8,439 | -0.8% | |||||
| 209 | Eaton | 8,355 | 8,418 | -0.7% | |||||
| 210 | St. Marys | 8,311 | 8,317 | -0.1% | |||||
| 211 | Shelby | 8,294 | 9,177 | -9.6% | |||||
| 212 | Oberlin | 8,253 | 8,298 | -0.5% | |||||
| 213 | Bellevue | 8,201 | 8,282 | -1.0% | |||||
| 214 | Kenwood | 8,143 | 7,229 | 12.6% | |||||
| 215 | Groesbeck | 8,110 | 6,778 | 19.7% | |||||
| 216 | Grandview Heights | 8,099 | 6,548 | 23.7% | |||||
| 217 | Kenton | 8,032 | 8,356 | -3.9% | |||||
| 218 | Withamsville | 7,899 | 6,557 | 20.5% | |||||
| 219 | Campbell | 7,831 | 8,444 | -7.3% | |||||
| 220 | Northridge | 7,791 | 7,754 | 0.5% | |||||
| 221 | Fairlawn | 7,697 | 7,469 | 3.1% | |||||
| 222 | Hubbard | 7,645 | 7,920 | -3.5% | |||||
| 223 | Landen | 7,605 | 6,853 | 11.0% | |||||
| 224 | Canfield | 7,605 | 7,493 | 1.5% | |||||
| 225 | Independence | 7,512 | 7,079 | 6.1% | |||||
| 226 | Chesterland | 7,481 | 2,420 | 209.1% | |||||
| 227 | Dry Run | 7,457 | 6,538 | 14.1% | |||||
| 228 | Wauseon | 7,277 | 6,905 | 5.4% | |||||
| 229 | Bellbrook | 7,266 | 6,989 | 4.0% | |||||
| 230 | Delphos | 7,165 | 7,151 | 0.2% | |||||
| 231 | Mentor-On-The-Lake | 7,135 | 7,584 | -5.9% | |||||
| 232 | Cortland | 7,087 | 7,028 | 0.8% | |||||
| 233 | Logan | 7,010 | 7,403 | -5.3% | |||||
| 234 | Uniontown | 6,992 | 3,433 | 103.7% | |||||
| 235 | Mount Healthy | 6,976 | 6,091 | 14.5% | |||||
| 236 | Huron | 6,950 | 7,243 | -4.0% | |||||
| 237 | Kirtland | 6,921 | 6,836 | 1.2% | |||||
| 238 | Union | 6,832 | 6,218 | 9.9% | |||||
| 239 | Portage Lakes | 6,802 | 6,501 | 4.6% | |||||
| 240 | Pepper Pike | 6,743 | 5,951 | 13.3% | |||||
| 241 | Howland Center | 6,720 | 5,489 | 22.4% | |||||
| 242 | Columbiana | 6,680 | 6,369 | 4.9% | |||||
| 243 | Belpre | 6,676 | 6,485 | 2.9% | |||||
| 244 | Covedale | 6,646 | 6,616 | 0.5% | |||||
| 245 | Ontario | 6,596 | 6,091 | 8.3% | |||||
| 246 | Upper Sandusky | 6,561 | 6,579 | -0.3% | |||||
| 247 | Milford | 6,549 | 6,664 | -1.7% | |||||
| 248 | Sunbury | 6,538 | 4,168 | 56.9% | |||||
| 249 | Hillsboro | 6,471 | 6,643 | -2.6% | |||||
| 250 | Moraine | 6,413 | 6,390 | 0.4% | |||||
| 251 | Martins Ferry | 6,370 | 6,953 | -8.4% | |||||
| 252 | Wheelersburg | 6,349 | 7,099 | -10.6% | |||||
| 253 | Rossford | 6,330 | 6,328 | 0.0% | |||||
| 254 | Clyde | 6,322 | 6,275 | 0.7% | |||||
| 255 | Fort Shawnee | 6,292 | 0 | nan% | |||||
| 256 | Grafton | 6,257 | 6,515 | -4.0% | |||||
| 257 | Champion Heights | 6,237 | 6,646 | -6.2% | |||||
| 258 | Jackson | 6,225 | 6,368 | -2.2% | |||||
| 259 | Northgate | 6,215 | 6,573 | -5.4% | |||||
| 260 | Willard | 6,204 | 6,382 | -2.8% | |||||
| 261 | South Lebanon | 6,157 | 3,809 | 61.6% | |||||
| 262 | Rittman | 6,153 | 6,523 | -5.7% | |||||
| 263 | Port Clinton | 6,055 | 6,140 | -1.4% | |||||
| 264 | The Village Of Indian Hill | 6,017 | 5,760 | 4.5% | |||||
| 265 | Brookville | 5,970 | 5,675 | 5.2% | |||||
| 266 | Geneva | 5,948 | 6,291 | -5.5% | |||||
| 267 | Waterville | 5,943 | 0 | nan% | |||||
| 268 | Groveport | 5,942 | 0 | nan% | |||||
| 269 | Montrose-Ghent | 5,786 | 5,133 | 12.7% | |||||
| 270 | Germantown | 5,748 | 0 | nan% | |||||
| 271 | Turpin Hills | 5,710 | 4,930 | 15.8% | |||||
| 272 | Granville | 5,675 | 5,593 | 1.5% | |||||
| 273 | New Carlisle | 5,561 | 5,814 | -4.4% | |||||
| 274 | Deer Park | 5,439 | 5,738 | -5.2% | |||||
| 275 | Carlisle | 5,436 | 0 | nan% | |||||
| 276 | Wellston | 5,408 | 5,737 | -5.7% | |||||
| 277 | Toronto | 5,395 | 5,015 | 7.6% | |||||
| 278 | Obetz | 5,351 | 4,250 | 25.9% | |||||
| 279 | Apple Valley | 5,344 | 4,896 | 9.2% | |||||
| 280 | Canal Fulton | 5,337 | 5,428 | -1.7% | |||||
| 281 | Uhrichsville | 5,275 | 5,474 | -3.6% | |||||
| 282 | Chardon | 5,212 | 5,182 | 0.6% | |||||
| 283 | Reminderville | 5,202 | 3,241 | 60.5% | |||||
| 284 | Northwood | 5,195 | 5,325 | -2.4% | |||||
| 285 | Ada | 5,187 | 6,028 | -14.0% | |||||
| 286 | John | 5,141 | 4,933 | 4.2% | |||||
| 287 | St. Clairsville | 5,121 | 5,193 | -1.4% | |||||
| 288 | Munroe Falls | 5,051 | 5,043 | 0.2% | |||||
| 289 | Lexington | 4,994 | 5,174 | -3.5% | |||||
| 290 | Delhi Hills | 4,978 | 5,021 | -0.9% | |||||
| 291 | Silverton | 4,890 | 0 | nan% | |||||
| 292 | Whitehouse | 4,786 | 3,893 | 22.9% | |||||
| 293 | Miami Heights | 4,786 | 4,575 | 4.6% | |||||
| 294 | Pleasant Run | 4,773 | 4,738 | 0.7% | |||||
| 295 | Ottawa Hills | 4,762 | 4,518 | 5.4% | |||||
| 296 | East Palestine | 4,739 | 0 | nan% | |||||
| 297 | New Burlington | 4,704 | 5,285 | -11.0% | |||||
| 298 | West Milton | 4,685 | 4,663 | 0.5% | |||||
| 299 | Mount Carmel | 4,661 | 4,887 | -4.6% | |||||
| 300 | Newton Falls | 4,570 | 0 | nan% | |||||
| 301 | Summerside | 4,515 | 5,311 | -15.0% | |||||
| 302 | Archbold | 4,509 | 4,191 | 7.6% | |||||
| 303 | Ashville | 4,505 | 3,960 | 13.8% | |||||
| 304 | Crestline | 4,496 | 0 | nan% | |||||
| 305 | Georg | 4,480 | 4,182 | 7.1% | |||||
| 306 | Edgewood | 4,441 | 4,384 | 1.3% | |||||
| 307 | Huber Ridge | 4,438 | 4,468 | -0.7% | |||||
| 308 | Ottawa | 4,430 | 4,484 | -1.2% | |||||
| 309 | Calcutta | 4,426 | 4,279 | 3.4% | |||||
| 310 | Coldwater | 4,406 | 4,172 | 5.6% | |||||
| 311 | Blanchester | 4,399 | 4,313 | 2.0% | |||||
| 312 | New Lexington | 4,335 | 5,061 | -14.3% | |||||
| 313 | Nelsonville | 4,319 | 5,228 | -17.4% | |||||
| 314 | Mulberry | 4,275 | 3,250 | 31.5% | |||||
| 315 | Park Layne | 4,252 | 4,493 | -5.4% | |||||
| 316 | Sebring | 4,227 | 4,512 | -6.3% | |||||
| 317 | West Jefferson | 4,227 | 4,221 | 0.1% | |||||
| 318 | Wellington | 4,213 | 4,926 | -14.5% | |||||
| 319 | Mount Orab | 4,200 | 3,945 | 6.5% | |||||
| 320 | Greenfield | 4,197 | 0 | nan% | |||||
| 321 | Waverly | 4,183 | 0 | nan% | |||||
| 322 | Fruit Hill | 4,181 | 3,920 | 6.7% | |||||
| 323 | Sheffield | 4,170 | 3,780 | 10.3% | |||||
| 324 | Chagrin Falls | 4,156 | 4,088 | 1.7% | |||||
| 325 | Cedarville | 4,148 | 4,086 | 1.5% | |||||
| 326 | Lake Darby | 4,144 | 4,656 | -11.0% | |||||
| 327 | St. Bernard | 4,052 | 0 | nan% | |||||
| 328 | Cherry Grove | 4,040 | 4,550 | -11.2% | |||||
| 329 | New Lebanon | 3,999 | 4,278 | -6.5% | |||||
| 330 | Mineral Ridge | 3,987 | 3,413 | 16.8% | |||||
| 331 | Swanton | 3,975 | 3,812 | 4.3% | |||||
| 332 | South Russell | 3,962 | 3,869 | 2.4% | |||||
| 333 | Montpelier | 3,947 | 4,140 | -4.7% | |||||
| 334 | Bellaire | 3,927 | 4,378 | -10.3% | |||||
| 335 | Mount Repose | 3,910 | 4,259 | -8.2% | |||||
| 336 | Pleasant Run Farm | 3,902 | 4,421 | -11.7% | |||||
| 337 | Wintersville | 3,892 | 3,871 | 0.5% | |||||
| 338 | Plain City | 3,882 | 3,805 | 2.0% | |||||
| 339 | Woodlawn | 3,844 | 3,171 | 21.2% | |||||
| 340 | Bluffton | 3,820 | 4,131 | -7.5% | |||||
| 341 | Newcomer | 3,809 | 3,880 | -1.8% | |||||
| 342 | Amberley | 3,798 | 3,541 | 7.3% | |||||
| 343 | Golf Manor | 3,782 | 3,648 | 3.7% | |||||
| 344 | Hunter | 3,775 | 2,509 | 50.5% | |||||
| 345 | Ballville | 3,771 | 3,174 | 18.8% | |||||
| 346 | Taylor Creek | 3,771 | 3,554 | 6.1% | |||||
| 347 | Yellow Springs | 3,750 | 3,637 | 3.1% | |||||
| 348 | Mogadore | 3,741 | 4,054 | -7.7% | |||||
| 349 | Richfield | 3,714 | 3,618 | 2.7% | |||||
| 350 | Greenhills | 3,711 | 3,671 | 1.1% | |||||
| 351 | Paulding | 3,604 | 3,893 | -7.4% | |||||
| 352 | Sixteen Mile Stand | 3,589 | 2,931 | 22.4% | |||||
| 353 | Brimfield | 3,585 | 3,318 | 8.0% | |||||
| 354 | Oakwood Village (Cuyahoga County) | 3,577 | 3,652 | -2.1% | |||||
| 355 | Barnesville | 3,569 | 4,532 | -21.2% | |||||
| 356 | Greentown | 3,566 | 3,212 | 11.0% | |||||
| 357 | Mount Healthy Heights | 3,554 | 3,479 | 2.2% | |||||
| 358 | Northfield | 3,550 | 3,709 | -4.3% | |||||
| 359 | Shadyside | 3,545 | 3,810 | -7.0% | |||||
| 360 | Four Bridges | 3,540 | 2,337 | 51.5% | |||||
| 361 | Carey | 3,498 | 3,826 | -8.6% | |||||
| 362 | Mariemont | 3,497 | 3,372 | 3.7% | |||||
| 363 | Lockland | 3,495 | 3,463 | 0.9% | |||||
| 364 | North Baltimore | 3,493 | 3,445 | 1.4% | |||||
| 365 | Sherwood | 3,485 | 3,482 | 0.1% | |||||
| 366 | Mingo Junction | 3,463 | 3,461 | 0.1% | |||||
| 367 | Lake Lakengren | 3,460 | 3,406 | 1.6% | |||||
| 368 | Moreland Hills | 3,436 | 3,309 | 3.8% | |||||
| 369 | Delshire | 3,428 | 3,192 | 7.4% | |||||
| 370 | Orange | 3,410 | 3,286 | 3.8% | |||||
| 371 | Madison | 3,396 | 3,137 | 8.3% | |||||
| 372 | Cleves | 3,380 | 3,115 | 8.5% | |||||
| 373 | Mayfield | 3,361 | 3,427 | -1.9% | |||||
| 374 | Dillonvale | 3,360 | 3,514 | -4.4% | |||||
| 375 | Jefferson | 3,350 | 3,235 | 3.6% | |||||
| 376 | Gallipolis | 3,348 | 3,560 | -6.0% | |||||
| 377 | Lord | 3,341 | 3,429 | -2.6% | |||||
| 378 | Hartville | 3,286 | 2,866 | 14.7% | |||||
| 379 | Minerva | 3,224 | 3,346 | -3.6% | |||||
| 380 | Carrollton | 3,186 | 3,397 | -6.2% | |||||
| 381 | Mcdonald | 3,170 | 3,307 | -4.1% | |||||
| 382 | Wellsville | 3,157 | 3,647 | -13.4% | |||||
| 383 | Lincoln Heights | 3,153 | 3,399 | -7.2% | |||||
| 384 | Millersburg | 3,141 | 3,071 | 2.3% | |||||
| 385 | West Union | 3,132 | 2,810 | 11.5% | |||||
| 386 | Fairport Harbor | 3,109 | 3,123 | -0.4% | |||||
| 387 | Mount Gilead | 3,108 | 3,789 | -18.0% | |||||
| 388 | Hicksville | 3,107 | 3,337 | -6.9% | |||||
| 389 | Dry Ridge | 3,095 | 3,144 | -1.6% | |||||
| 390 | Cadiz | 3,060 | 3,336 | -8.3% | |||||
| 391 | Doyle | 3,059 | 3,026 | 1.1% | |||||
| 392 | Beechwood Trails | 3,049 | 3,262 | -6.5% | |||||
| 393 | Walbridge | 3,037 | 3,088 | -1.7% | |||||
| 394 | Minster | 3,035 | 2,670 | 13.7% | |||||
| 395 | Richville | 3,015 | 3,405 | -11.5% | |||||
| 396 | Baltimore | 2,985 | 2,984 | 0.0% | |||||
| 397 | Lakemore | 2,944 | 2,994 | -1.7% | |||||
| 398 | Versailles | 2,939 | 2,651 | 10.9% | |||||
| 399 | South Point | 2,912 | 3,773 | -22.8% | |||||
| 400 | Commercial Point | 2,902 | 1,197 | 142.4% | |||||
| 401 | Burlington | 2,892 | 2,516 | 14.9% | |||||
| 402 | Ross | 2,872 | 3,246 | -11.5% | |||||
| 403 | Devola | 2,806 | 2,600 | 7.9% | |||||
| 404 | Delta | 2,790 | 2,980 | -6.4% | |||||
| 405 | New Bremen | 2,778 | 3,006 | -7.6% | |||||
| 406 | North Kingsville | 2,762 | 2,877 | -4.0% | |||||
| 407 | Lodi | 2,750 | 2,828 | -2.8% | |||||
| 408 | Oak Harbor | 2,741 | 2,780 | -1.4% | |||||
| 409 | Middlefield | 2,738 | 2,626 | 4.3% | |||||
| 410 | New Richmond | 2,726 | 2,557 | 6.6% | |||||
| 411 | St. Henry | 2,724 | 2,774 | -1.8% | |||||
| 412 | Loudonville | 2,719 | 2,818 | -3.5% | |||||
| 413 | Waynesville | 2,704 | 2,876 | -6.0% | |||||
| 414 | Ne | 2,679 | 2,618 | 2.3% | |||||
| 415 | West Portsmouth | 2,679 | 3,092 | -13.4% | |||||
| 416 | New Boston | 2,672 | 2,308 | 15.8% | |||||
| 417 | Evendale | 2,664 | 2,809 | -5.2% | |||||
| 418 | Arcanum | 2,661 | 2,400 | 10.9% | |||||
| 419 | Garrettsville | 2,655 | 2,660 | -0.2% | |||||
| 420 | Strasburg | 2,654 | 2,706 | -1.9% | |||||
| 421 | Bethel | 2,647 | 2,727 | -2.9% | |||||
| 422 | The Plains | 2,644 | 3,115 | -15.1% | |||||
| 423 | West Lafayette | 2,638 | 2,304 | 14.5% | |||||
| 424 | New Concord | 2,632 | 2,459 | 7.0% | |||||
| 425 | Batavia | 2,614 | 1,464 | 78.6% | |||||
| 426 | Frederic | 2,613 | 2,496 | 4.7% | |||||
| 427 | Lisbon | 2,591 | 2,901 | -10.7% | |||||
| 428 | Lagrange | 2,591 | 1,886 | 37.4% | |||||
| 429 | Silver Lake | 2,569 | 2,561 | 0.3% | |||||
| 430 | Sabina | 2,567 | 2,716 | -5.5% | |||||
| 431 | Covington | 2,563 | 2,605 | -1.6% | |||||
| 432 | Williamsburg | 2,554 | 2,411 | 5.9% | |||||
| 433 | Gibsonburg | 2,549 | 2,629 | -3.0% | |||||
| 434 | New London | 2,543 | 2,459 | 3.4% | |||||
| 435 | Enon | 2,529 | 2,557 | -1.1% | |||||
| 436 | Buckeye Lake | 2,529 | 2,798 | -9.6% | |||||
| 437 | South Bloomfield | 2,528 | 1,740 | 45.3% | |||||
| 438 | Seville | 2,510 | 2,154 | 16.5% | |||||
| 439 | Shawnee Hills | 2,502 | 2,206 | 13.4% | |||||
| 440 | Crooksville | 2,466 | 2,543 | -3.0% | |||||
| 441 | Day Heights | 2,444 | 2,718 | -10.1% | |||||
| 442 | Dennison | 2,416 | 3,205 | -24.6% | |||||
| 443 | Woodsfield | 2,387 | 2,438 | -2.1% | |||||
| 444 | Wilberforce | 2,386 | 1,068 | 123.4% | |||||
| 445 | Sugarcreek | 2,375 | 2,233 | 6.4% | |||||
| 446 | Poland | 2,352 | 2,601 | -9.6% | |||||
| 447 | Leipsic | 2,340 | 2,242 | 4.4% | |||||
| 448 | Masury | 2,314 | 2,290 | 1.0% | |||||
| 449 | Gambier | 2,311 | 2,200 | 5.0% | |||||
| 450 | New Miami | 2,300 | 2,198 | 4.6% | |||||
| 451 | Lithopolis | 2,291 | 631 | 263.1% | |||||
| 452 | Mcconnelsville | 2,282 | 1,796 | 27.1% | |||||
| 453 | Hebron | 2,268 | 2,053 | 10.5% | |||||
| 454 | Bolindale | 2,237 | 2,870 | -22.1% | |||||
| 455 | Caldwell | 2,235 | 1,400 | 59.6% | |||||
| 456 | Piketon | 2,232 | 1,874 | 19.1% | |||||
| 457 | Byesville | 2,232 | 2,315 | -3.6% | |||||
| 458 | Green Meadows | 2,227 | 2,365 | -5.8% | |||||
| 459 | Elmwood Place | 2,215 | 2,012 | 10.1% | |||||
| 460 | Morrow | 2,214 | 1,342 | 65.0% | |||||
| 461 | North Zanesville | 2,205 | 3,027 | -27.2% | |||||
| 462 | Richwood | 2,202 | 2,236 | -1.5% | |||||
| 463 | Choctaw Lake | 2,196 | 1,558 | 40.9% | |||||
| 464 | St. Paris | 2,189 | 1,984 | 10.3% | |||||
| 465 | Gates Mills | 2,189 | 2,171 | 0.8% | |||||
| 466 | Roseville | 2,183 | 1,853 | 17.8% | |||||
| 467 | Walton Hills | 2,151 | 2,259 | -4.8% | |||||
| 468 | Fairfax | 2,147 | 1,766 | 21.6% | |||||
| 469 | Utica | 2,145 | 2,176 | -1.4% | |||||
| 470 | Mount Sterling | 2,116 | 1,822 | 16.1% | |||||
| 471 | West Hill | 2,115 | 2,147 | -1.5% | |||||
| 472 | Leetonia | 2,099 | 1,961 | 7.0% | |||||
| 473 | Jame | 2,085 | 1,870 | 11.5% | |||||
| 474 | Rosemount | 2,075 | 2,198 | -5.6% | |||||
| 475 | Spencerville | 2,065 | 2,245 | -8.0% | |||||
| 476 | Coal Grove | 2,055 | 2,094 | -1.9% | |||||
| 477 | Middleport | 2,050 | 2,526 | -18.8% | |||||
| 478 | Camden | 2,049 | 1,917 | 6.9% | |||||
| 479 | Orwell | 2,044 | 1,475 | 38.6% | |||||
| 480 | Genoa | 2,036 | 2,641 | -22.9% | |||||
| 481 | Bradford | 2,024 | 1,869 | 8.3% | |||||
| 482 | Churchill | 2,014 | 2,644 | -23.8% | |||||
| 483 | Terrace Park | 2,012 | 2,250 | -10.6% | |||||
| 484 | Cridersville | 2,009 | 1,871 | 7.4% | |||||
| 485 | Edgerton | 2,008 | 2,040 | -1.6% | |||||
| 486 | Elida | 1,996 | 2,148 | -7.1% | |||||
| 487 | Brewster | 1,994 | 2,314 | -13.8% | |||||
| 488 | Maineville | 1,990 | 822 | 142.1% | |||||
| 489 | Peebles | 1,981 | 2,087 | -5.1% | |||||
| 490 | Valley View | 1,980 | 1,946 | 1.7% | |||||
| 491 | Woodville | 1,976 | 2,003 | -1.3% | |||||
| 492 | Glendale | 1,930 | 2,314 | -16.6% | |||||
| 493 | Bellville | 1,926 | 2,043 | -5.7% | |||||
| 494 | Oak Hill | 1,925 | 1,767 | 8.9% | |||||
| 495 | New California | 1,918 | 1,347 | 42.4% | |||||
| 496 | West Unity | 1,904 | 1,895 | 0.5% | |||||
| 497 | Creston | 1,903 | 2,255 | -15.6% | |||||
| 498 | South Amherst | 1,891 | 1,840 | 2.8% | |||||
| 499 | South Zanesville | 1,882 | 1,906 | -1.3% | |||||
| 500 | Columbus Grove | 1,870 | 2,016 | -7.2% | |||||