Forest Grove, OR
Demographics And Statistics
Living In Forest Grove, Oregon Summary
Life in Forest Grove research summary. HomeSnacks has been using Saturday Night Science to research the quality of life in Forest Grove over the past nine years using Census, FBI, Zillow, and other primary data sources. Based on the most recently available data, we found the following about life in Forest Grove:
The population in Forest Grove is 26,160.
The median home value in Forest Grove is $512,087.
The median income in Forest Grove is $77,977.
The cost of living in Forest Grove is 112 which is 1.1x higher than the national average.
The median rent in Forest Grove is $1,282.
The unemployment rate in Forest Grove is 4.3%.
The poverty rate in Forest Grove is 13.6%.
The average high in Forest Grove is 62.8° and the average low is 42.9°.
Forest Grove SnackAbility
Overall SnackAbility
Forest Grove, OR Crime Report
Crime in Forest Grove summary. We use data from the FBI to determine the crime rates in Forest Grove. Key points include:
There were 573 total crimes in Forest Grove in the last reporting year.
The overall crime rate per 100,000 people in Forest Grove is 2,202.5 / 100k people.
The violent crime rate per 100,000 people in Forest Grove is 342.1 / 100k people.
The property crime rate per 100,000 people in Forest Grove is 1,860.4 / 100k people.
Overall, crime in Forest Grove is -5.24% below the national average.
Total Crimes
Below National Average
Crime In Forest Grove Comparison Table
| Statistic | Count Raw |
Forest Grove / 100k People |
Oregon / 100k People |
National / 100k People |
|---|---|---|---|---|
| Total Crimes Per 100K | 573 | 2,202.5 | 2,950.9 | 2,324.2 |
| Violent Crime | 89 | 342.1 | 291.9 | 369.8 |
| Murder | 1 | 3.8 | 2.9 | 6.3 |
| Robbery | 11 | 42.3 | 51.4 | 66.1 |
| Aggravated Assault | 60 | 230.6 | 200.6 | 268.2 |
| Property Crime | 484 | 1,860.4 | 2,659.0 | 1,954.4 |
| Burglary | 58 | 222.9 | 339.2 | 269.8 |
| Larceny | 382 | 1,468.3 | 1,928.8 | 1,401.9 |
| Car Theft | 44 | 169.1 | 391.0 | 282.7 |
Forest Grove, OR Cost Of Living
Cost of living in Forest Grove summary. We use data on the cost of living to determine how expensive it is to live in Forest Grove. Real estate prices drive most of the variance in cost of living around Oregon. Key points include:
The cost of living in Forest Grove is 112 with 100 being average.
The cost of living in Forest Grove is 1.1x higher than the national average.
The median home value in Forest Grove is $512,087.
The median income in Forest Grove is $77,977.
Forest Grove's Overall Cost Of Living
Higher Than The National Average
Cost Of Living In Forest Grove Comparison Table
| Living Expense | Forest Grove | Oregon | National Average | |
|---|---|---|---|---|
| Overall | 112 | 116 | 100 | |
| Services | 114 | 106 | 100 | |
| Groceries | 108 | 107 | 100 | |
| Health | 106 | 103 | 100 | |
| Housing | 116 | 140 | 100 | |
| Transportation | 121 | 117 | 100 | |
| Utilities | 93 | 97 | 100 | |
Forest Grove, OR Weather
The average high in Forest Grove is 62.8° and the average low is 42.9°.
There are 93.6 days of precipitation each year.
Expect an average of 43.7 inches of precipitation each year with 3.8 inches of snow.
| Stat | Forest Grove |
|---|---|
| Average Annual High | 62.8 |
| Average Annual Low | 42.9 |
| Annual Precipitation Days | 93.6 |
| Average Annual Precipitation | 43.7 |
| Average Annual Snowfall | 3.8 |
Average High
Days of Rain
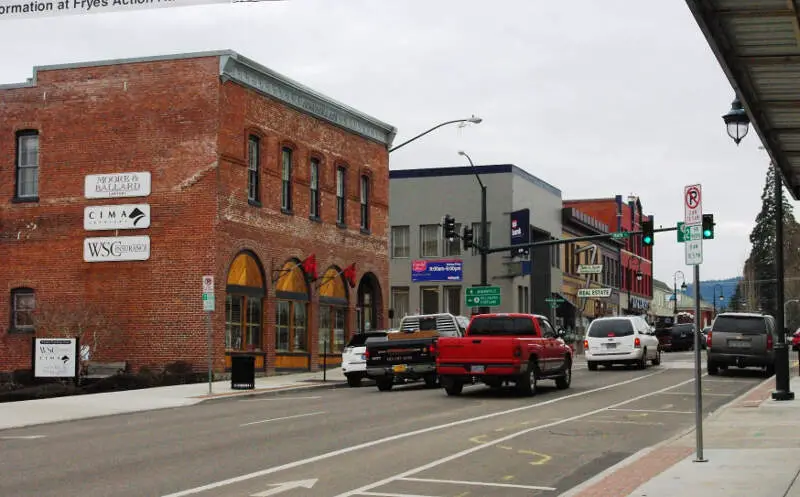
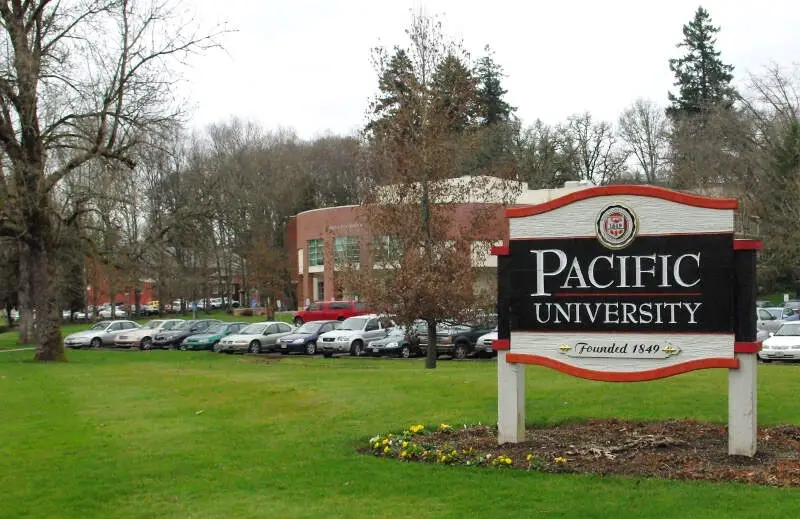
Forest Grove, OR Photos

Rankings for Forest Grove in Oregon


Locations Around Forest Grove
Map Of Forest Grove, OR
Best Places Around Forest Grove
Sherwood, OR
Population 20,286
Bethany, OR
Population 30,983
Bull Mountain, OR
Population 9,319
Oak Hills, OR
Population 11,780
Tigard, OR
Population 55,161
Aloha, OR
Population 53,532
Cedar Hills, OR
Population 9,076
Rockcreek, OR
Population 9,923
Tualatin, OR
Population 27,804
Newberg, OR
Population 25,379
Forest Grove Demographics And Statistics
Population over time in Forest Grove
The current population in Forest Grove is 26,160. The population has increased 26.8% from 2010.
| Year | Population | % Change |
|---|---|---|
| 2022 | 26,160 | 9.4% |
| 2021 | 23,923 | 1.6% |
| 2020 | 23,554 | 1.5% |
| 2019 | 23,214 | 1.7% |
| 2018 | 22,823 | 3.4% |
| 2017 | 22,070 | 2.2% |
| 2016 | 21,593 | 1.6% |
| 2015 | 21,245 | 1.6% |
| 2014 | 20,908 | 1.3% |
| 2013 | 20,635 | - |
Race / Ethnicity in Forest Grove
Forest Grove is:
63.4% White with 16,589 White residents.
1.0% African American with 256 African American residents.
0.1% American Indian with 25 American Indian residents.
2.3% Asian with 608 Asian residents.
0.0% Hawaiian with 0 Hawaiian residents.
0.2% Other with 54 Other residents.
3.5% Two Or More with 927 Two Or More residents.
29.4% Hispanic with 7,701 Hispanic residents.
| Race | Forest Grove | OR | USA |
|---|---|---|---|
| White | 63.4% | 73.3% | 58.9% |
| African American | 1.0% | 1.8% | 12.1% |
| American Indian | 0.1% | 0.7% | 0.6% |
| Asian | 2.3% | 4.4% | 5.7% |
| Hawaiian | 0.0% | 0.4% | 0.2% |
| Other | 0.2% | 0.4% | 0.4% |
| Two Or More | 3.5% | 5.2% | 3.5% |
| Hispanic | 29.4% | 13.8% | 18.7% |
Gender in Forest Grove
Forest Grove is 52.7% female with 13,775 female residents.
Forest Grove is 47.3% male with 12,385 male residents.
| Gender | Forest Grove | OR | USA |
|---|---|---|---|
| Female | 52.7% | 50.0% | 50.4% |
| Male | 47.3% | 50.0% | 49.6% |
Highest level of educational attainment in Forest Grove for adults over 25
6.0% of adults in Forest Grove completed < 9th grade.
6.0% of adults in Forest Grove completed 9-12th grade.
21.0% of adults in Forest Grove completed high school / ged.
27.0% of adults in Forest Grove completed some college.
7.0% of adults in Forest Grove completed associate's degree.
21.0% of adults in Forest Grove completed bachelor's degree.
9.0% of adults in Forest Grove completed master's degree.
1.0% of adults in Forest Grove completed professional degree.
2.0% of adults in Forest Grove completed doctorate degree.
| Education | Forest Grove | OR | USA |
|---|---|---|---|
| < 9th Grade | 6.0% | 5.0% | 4.0% |
| 9-12th Grade | 6.0% | 5.0% | 6.0% |
| High School / GED | 21.0% | 22.0% | 26.0% |
| Some College | 27.0% | 24.0% | 20.0% |
| Associate's Degree | 7.0% | 9.0% | 9.0% |
| Bachelor's Degree | 21.0% | 22.0% | 21.0% |
| Master's Degree | 9.0% | 9.0% | 10.0% |
| Professional Degree | 1.0% | 2.0% | 2.0% |
| Doctorate Degree | 2.0% | 2.0% | 2.0% |
Household Income For Forest Grove, Oregon
6.7% of households in Forest Grove earn Less than $10,000.
3.2% of households in Forest Grove earn $10,000 to $14,999.
7.6% of households in Forest Grove earn $15,000 to $24,999.
6.7% of households in Forest Grove earn $25,000 to $34,999.
10.0% of households in Forest Grove earn $35,000 to $49,999.
13.3% of households in Forest Grove earn $50,000 to $74,999.
13.7% of households in Forest Grove earn $75,000 to $99,999.
21.1% of households in Forest Grove earn $100,000 to $149,999.
10.8% of households in Forest Grove earn $150,000 to $199,999.
6.7% of households in Forest Grove earn $200,000 or more.
| Income | Forest Grove | OR | USA |
|---|---|---|---|
| Less than $10,000 | 6.7% | 4.4% | 4.9% |
| $10,000 to $14,999 | 3.2% | 3.5% | 3.8% |
| $15,000 to $24,999 | 7.6% | 6.8% | 7.0% |
| $25,000 to $34,999 | 6.7% | 6.9% | 7.4% |
| $35,000 to $49,999 | 10.0% | 10.9% | 10.7% |
| $50,000 to $74,999 | 13.3% | 16.5% | 16.1% |
| $75,000 to $99,999 | 13.7% | 13.4% | 12.8% |
| $100,000 to $149,999 | 21.1% | 18.0% | 17.1% |
| $150,000 to $199,999 | 10.8% | 9.1% | 8.8% |
| $200,000 or more | 6.7% | 10.5% | 11.4% |


