Grants Pass, OR
Demographics And Statistics
Living In Grants Pass, Oregon Summary
Life in Grants Pass research summary. HomeSnacks has been using Saturday Night Science to research the quality of life in Grants Pass over the past nine years using Census, FBI, Zillow, and other primary data sources. Based on the most recently available data, we found the following about life in Grants Pass:
The population in Grants Pass is 39,131.
The median home value in Grants Pass is $398,971.
The median income in Grants Pass is $53,941.
The cost of living in Grants Pass is 106 which is 1.1x higher than the national average.
The median rent in Grants Pass is $1,086.
The unemployment rate in Grants Pass is 6.3%.
The poverty rate in Grants Pass is 15.7%.
The average high in Grants Pass is 67.7° and the average low is 40.7°.
Grants Pass SnackAbility
Overall SnackAbility
Grants Pass, OR Crime Report
Crime in Grants Pass summary. We use data from the FBI to determine the crime rates in Grants Pass. Key points include:
There were 1,709 total crimes in Grants Pass in the last reporting year.
The overall crime rate per 100,000 people in Grants Pass is 4,324.5 / 100k people.
The violent crime rate per 100,000 people in Grants Pass is 369.4 / 100k people.
The property crime rate per 100,000 people in Grants Pass is 3,955.1 / 100k people.
Overall, crime in Grants Pass is 86.06% above the national average.
Total Crimes
Above National Average
Crime In Grants Pass Comparison Table
| Statistic | Count Raw |
Grants Pass / 100k People |
Oregon / 100k People |
National / 100k People |
|---|---|---|---|---|
| Total Crimes Per 100K | 1,709 | 4,324.5 | 2,950.9 | 2,324.2 |
| Violent Crime | 146 | 369.4 | 291.9 | 369.8 |
| Murder | 1 | 2.5 | 2.9 | 6.3 |
| Robbery | 39 | 98.7 | 51.4 | 66.1 |
| Aggravated Assault | 86 | 217.6 | 200.6 | 268.2 |
| Property Crime | 1,563 | 3,955.1 | 2,659.0 | 1,954.4 |
| Burglary | 128 | 323.9 | 339.2 | 269.8 |
| Larceny | 1,280 | 3,238.9 | 1,928.8 | 1,401.9 |
| Car Theft | 155 | 392.2 | 391.0 | 282.7 |
Grants Pass, OR Cost Of Living
Cost of living in Grants Pass summary. We use data on the cost of living to determine how expensive it is to live in Grants Pass. Real estate prices drive most of the variance in cost of living around Oregon. Key points include:
The cost of living in Grants Pass is 106 with 100 being average.
The cost of living in Grants Pass is 1.1x higher than the national average.
The median home value in Grants Pass is $398,971.
The median income in Grants Pass is $53,941.
Grants Pass's Overall Cost Of Living
Higher Than The National Average
Cost Of Living In Grants Pass Comparison Table
| Living Expense | Grants Pass | Oregon | National Average | |
|---|---|---|---|---|
| Overall | 106 | 116 | 100 | |
| Services | 105 | 106 | 100 | |
| Groceries | 106 | 107 | 100 | |
| Health | 100 | 103 | 100 | |
| Housing | 98 | 140 | 100 | |
| Transportation | 142 | 117 | 100 | |
| Utilities | 125 | 97 | 100 | |
Grants Pass, OR Weather
The average high in Grants Pass is 67.7° and the average low is 40.7°.
There are 63.8 days of precipitation each year.
Expect an average of 31.4 inches of precipitation each year with 14.3 inches of snow.
| Stat | Grants Pass |
|---|---|
| Average Annual High | 67.7 |
| Average Annual Low | 40.7 |
| Annual Precipitation Days | 63.8 |
| Average Annual Precipitation | 31.4 |
| Average Annual Snowfall | 14.3 |
Average High
Days of Rain
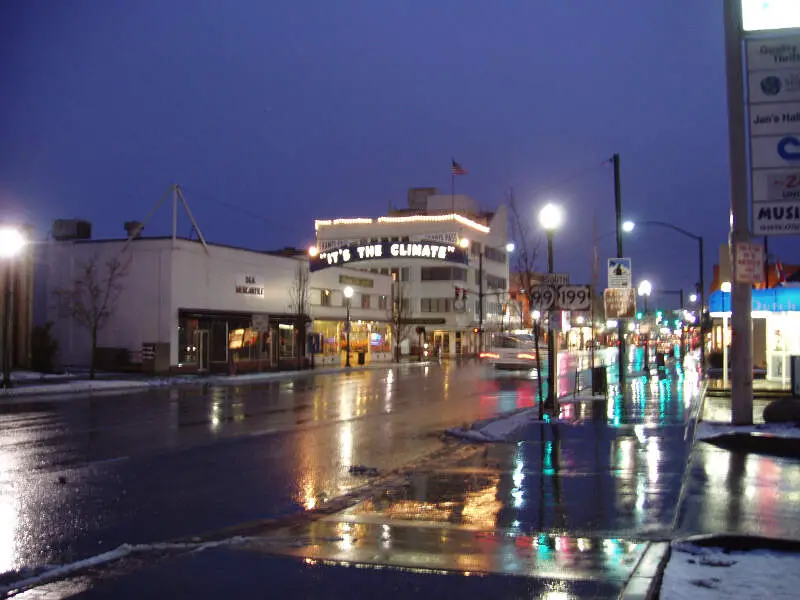
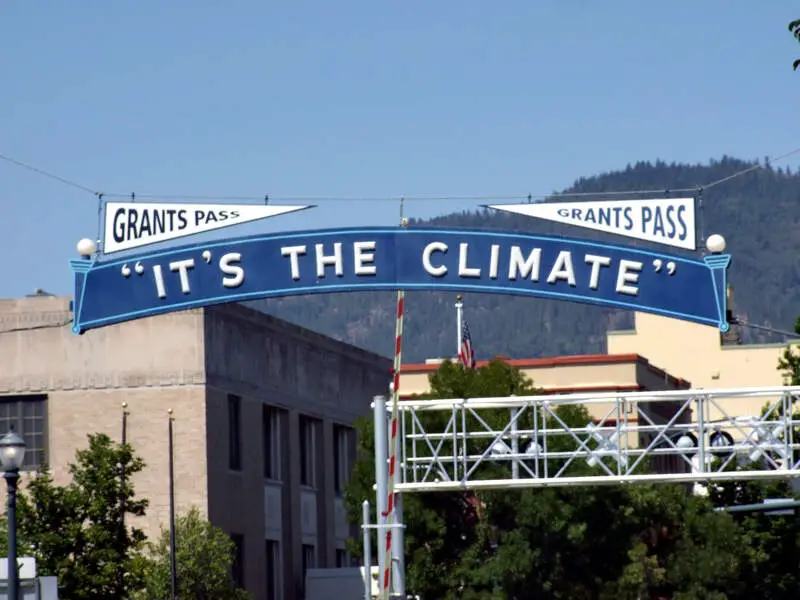
Grants Pass, OR Photos
5 Reviews & Comments About Grants Pass
/5

TheGypsy319 -
And then you have the retirement magazine touting Southern OR and Grants Pass as the number one retirement areas in the nation. Not once...... but three different occasions. Also the close neighbors of Jacksonville and other communities. All in the eye of the beholder...... I was born and raised in WA, traveled, lived and worked in many of these United States and for 20 years have been in the Rouge Valley. Wouldn't be anywhere else. More arts, music, outdoor activities than anywhere I've lived. In fact, during a study, it was found that, per capita, there are more artists and musician in the Rogue Valley than anywhere on the entire West Coast. Must be why on any given weekend there are so many choices of things to do, you can't decide! Perspective.........
U.S. Army Airforce -
hey dude I live in Grants Pass OR and I love it we have one of the best high schools in southern Oregon so just shut up and don't talk about us like that again!!!
Airous04 -
I Live in grants pass and I'm pretty g*d damm sure we have better grades then your hometown has. Unless you took North middle school grades.its full of queers stoners and goths
The_Burchfield -
Hey I live in grants a*s. That was spot on... Wait... F**k
HomeSnacks User - 2018-07-15 18:46:37.342383
This is such a great little river town. The people are friendly and the climate is amazing. Not too terribly hot in the summer and the winters are mild. The rainfall is nice and the surrounding forest is green and beautiful. The schools are good, although most are quite old and need lots of repairs but the teachers are great.
Some of the best places to visit is the Rogue River for sure. There are rafting trips you can take. There are plenty of opportunities for fishing and the coast is only about 2 hours away if you want to go to the beach. The California Redwoods are nearby and the drive there is one of the most beautiful you will ever take.
Rankings for Grants Pass in Oregon


Locations Around Grants Pass
Map Of Grants Pass, OR
Best Places Around Grants Pass
Central Point, OR
Population 19,123
Green, OR
Population 8,151
Ashland, OR
Population 21,401
Eagle Point, OR
Population 9,735
Medford, OR
Population 85,539
Talent, OR
Population 6,256
Winston, OR
Population 5,618
Grants Pass Demographics And Statistics
Population over time in Grants Pass
The current population in Grants Pass is 39,131. The population has increased 15.5% from 2010.
| Year | Population | % Change |
|---|---|---|
| 2022 | 39,131 | 5.2% |
| 2021 | 37,201 | 1.4% |
| 2020 | 36,687 | -0.2% |
| 2019 | 36,776 | 1.1% |
| 2018 | 36,378 | 4.2% |
| 2017 | 34,916 | 0.7% |
| 2016 | 34,672 | 0.6% |
| 2015 | 34,454 | 0.8% |
| 2014 | 34,180 | 0.9% |
| 2013 | 33,883 | - |
Race / Ethnicity in Grants Pass
Grants Pass is:
82.1% White with 32,129 White residents.
0.5% African American with 178 African American residents.
0.4% American Indian with 140 American Indian residents.
1.1% Asian with 435 Asian residents.
0.3% Hawaiian with 104 Hawaiian residents.
0.2% Other with 96 Other residents.
5.2% Two Or More with 2,039 Two Or More residents.
10.2% Hispanic with 4,010 Hispanic residents.
| Race | Grants Pass | OR | USA |
|---|---|---|---|
| White | 82.1% | 73.3% | 58.9% |
| African American | 0.5% | 1.8% | 12.1% |
| American Indian | 0.4% | 0.7% | 0.6% |
| Asian | 1.1% | 4.4% | 5.7% |
| Hawaiian | 0.3% | 0.4% | 0.2% |
| Other | 0.2% | 0.4% | 0.4% |
| Two Or More | 5.2% | 5.2% | 3.5% |
| Hispanic | 10.2% | 13.8% | 18.7% |
Gender in Grants Pass
Grants Pass is 52.6% female with 20,579 female residents.
Grants Pass is 47.4% male with 18,552 male residents.
| Gender | Grants Pass | OR | USA |
|---|---|---|---|
| Female | 52.6% | 50.0% | 50.4% |
| Male | 47.4% | 50.0% | 49.6% |
Highest level of educational attainment in Grants Pass for adults over 25
2.0% of adults in Grants Pass completed < 9th grade.
7.0% of adults in Grants Pass completed 9-12th grade.
30.0% of adults in Grants Pass completed high school / ged.
31.0% of adults in Grants Pass completed some college.
11.0% of adults in Grants Pass completed associate's degree.
12.0% of adults in Grants Pass completed bachelor's degree.
5.0% of adults in Grants Pass completed master's degree.
1.0% of adults in Grants Pass completed professional degree.
1.0% of adults in Grants Pass completed doctorate degree.
| Education | Grants Pass | OR | USA |
|---|---|---|---|
| < 9th Grade | 2.0% | 5.0% | 4.0% |
| 9-12th Grade | 7.0% | 5.0% | 6.0% |
| High School / GED | 30.0% | 22.0% | 26.0% |
| Some College | 31.0% | 24.0% | 20.0% |
| Associate's Degree | 11.0% | 9.0% | 9.0% |
| Bachelor's Degree | 12.0% | 22.0% | 21.0% |
| Master's Degree | 5.0% | 9.0% | 10.0% |
| Professional Degree | 1.0% | 2.0% | 2.0% |
| Doctorate Degree | 1.0% | 2.0% | 2.0% |
Household Income For Grants Pass, Oregon
6.3% of households in Grants Pass earn Less than $10,000.
5.0% of households in Grants Pass earn $10,000 to $14,999.
10.8% of households in Grants Pass earn $15,000 to $24,999.
10.2% of households in Grants Pass earn $25,000 to $34,999.
14.6% of households in Grants Pass earn $35,000 to $49,999.
17.8% of households in Grants Pass earn $50,000 to $74,999.
12.2% of households in Grants Pass earn $75,000 to $99,999.
13.4% of households in Grants Pass earn $100,000 to $149,999.
5.4% of households in Grants Pass earn $150,000 to $199,999.
4.4% of households in Grants Pass earn $200,000 or more.
| Income | Grants Pass | OR | USA |
|---|---|---|---|
| Less than $10,000 | 6.3% | 4.4% | 4.9% |
| $10,000 to $14,999 | 5.0% | 3.5% | 3.8% |
| $15,000 to $24,999 | 10.8% | 6.8% | 7.0% |
| $25,000 to $34,999 | 10.2% | 6.9% | 7.4% |
| $35,000 to $49,999 | 14.6% | 10.9% | 10.7% |
| $50,000 to $74,999 | 17.8% | 16.5% | 16.1% |
| $75,000 to $99,999 | 12.2% | 13.4% | 12.8% |
| $100,000 to $149,999 | 13.4% | 18.0% | 17.1% |
| $150,000 to $199,999 | 5.4% | 9.1% | 8.8% |
| $200,000 or more | 4.4% | 10.5% | 11.4% |


