Hillsboro, OR
Demographics And Statistics
Living In Hillsboro, Oregon Summary
Life in Hillsboro research summary. HomeSnacks has been using Saturday Night Science to research the quality of life in Hillsboro over the past nine years using Census, FBI, Zillow, and other primary data sources. Based on the most recently available data, we found the following about life in Hillsboro:
The population in Hillsboro is 106,612.
The median home value in Hillsboro is $527,280.
The median income in Hillsboro is $98,891.
The cost of living in Hillsboro is 118 which is 1.2x higher than the national average.
The median rent in Hillsboro is $1,797.
The unemployment rate in Hillsboro is 4.6%.
The poverty rate in Hillsboro is 7.9%.
The average high in Hillsboro is 63.0° and the average low is 43.3°.
Hillsboro SnackAbility
Overall SnackAbility
Hillsboro, OR Crime Report
Crime in Hillsboro summary. We use data from the FBI to determine the crime rates in Hillsboro. Key points include:
There were 3,045 total crimes in Hillsboro in the last reporting year.
The overall crime rate per 100,000 people in Hillsboro is 2,863.3 / 100k people.
The violent crime rate per 100,000 people in Hillsboro is 296.2 / 100k people.
The property crime rate per 100,000 people in Hillsboro is 2,567.1 / 100k people.
Overall, crime in Hillsboro is 23.20% above the national average.
Total Crimes
Above National Average
Crime In Hillsboro Comparison Table
| Statistic | Count Raw |
Hillsboro / 100k People |
Oregon / 100k People |
National / 100k People |
|---|---|---|---|---|
| Total Crimes Per 100K | 3,045 | 2,863.3 | 2,950.9 | 2,324.2 |
| Violent Crime | 315 | 296.2 | 291.9 | 369.8 |
| Murder | 4 | 3.8 | 2.9 | 6.3 |
| Robbery | 63 | 59.2 | 51.4 | 66.1 |
| Aggravated Assault | 190 | 178.7 | 200.6 | 268.2 |
| Property Crime | 2,730 | 2,567.1 | 2,659.0 | 1,954.4 |
| Burglary | 318 | 299.0 | 339.2 | 269.8 |
| Larceny | 2,077 | 1,953.1 | 1,928.8 | 1,401.9 |
| Car Theft | 335 | 315.0 | 391.0 | 282.7 |
Hillsboro, OR Cost Of Living
Cost of living in Hillsboro summary. We use data on the cost of living to determine how expensive it is to live in Hillsboro. Real estate prices drive most of the variance in cost of living around Oregon. Key points include:
The cost of living in Hillsboro is 118 with 100 being average.
The cost of living in Hillsboro is 1.2x higher than the national average.
The median home value in Hillsboro is $527,280.
The median income in Hillsboro is $98,891.
Hillsboro's Overall Cost Of Living
Higher Than The National Average
Cost Of Living In Hillsboro Comparison Table
| Living Expense | Hillsboro | Oregon | National Average | |
|---|---|---|---|---|
| Overall | 118 | 116 | 100 | |
| Services | 114 | 106 | 100 | |
| Groceries | 107 | 107 | 100 | |
| Health | 107 | 103 | 100 | |
| Housing | 133 | 140 | 100 | |
| Transportation | 121 | 117 | 100 | |
| Utilities | 93 | 97 | 100 | |
Hillsboro, OR Weather
The average high in Hillsboro is 63.0° and the average low is 43.3°.
There are 95.8 days of precipitation each year.
Expect an average of 38.0 inches of precipitation each year with 2.1 inches of snow.
| Stat | Hillsboro |
|---|---|
| Average Annual High | 63.0 |
| Average Annual Low | 43.3 |
| Annual Precipitation Days | 95.8 |
| Average Annual Precipitation | 38.0 |
| Average Annual Snowfall | 2.1 |
Average High
Days of Rain
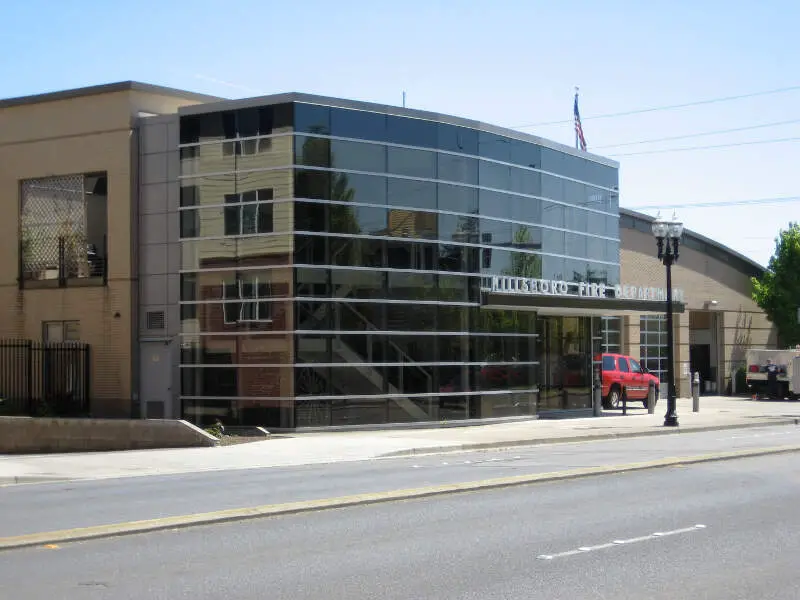
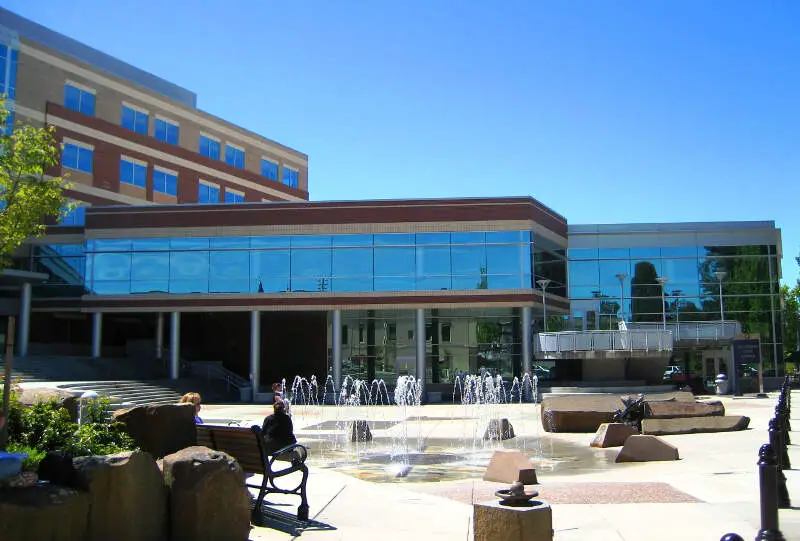
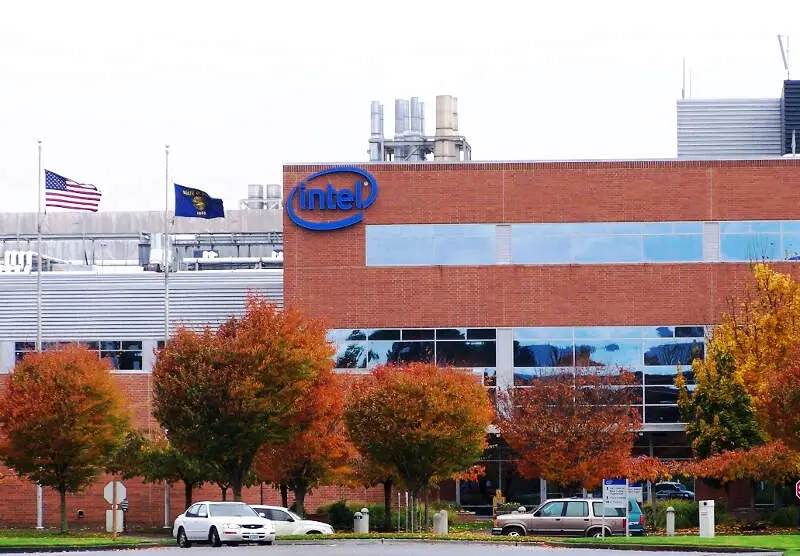
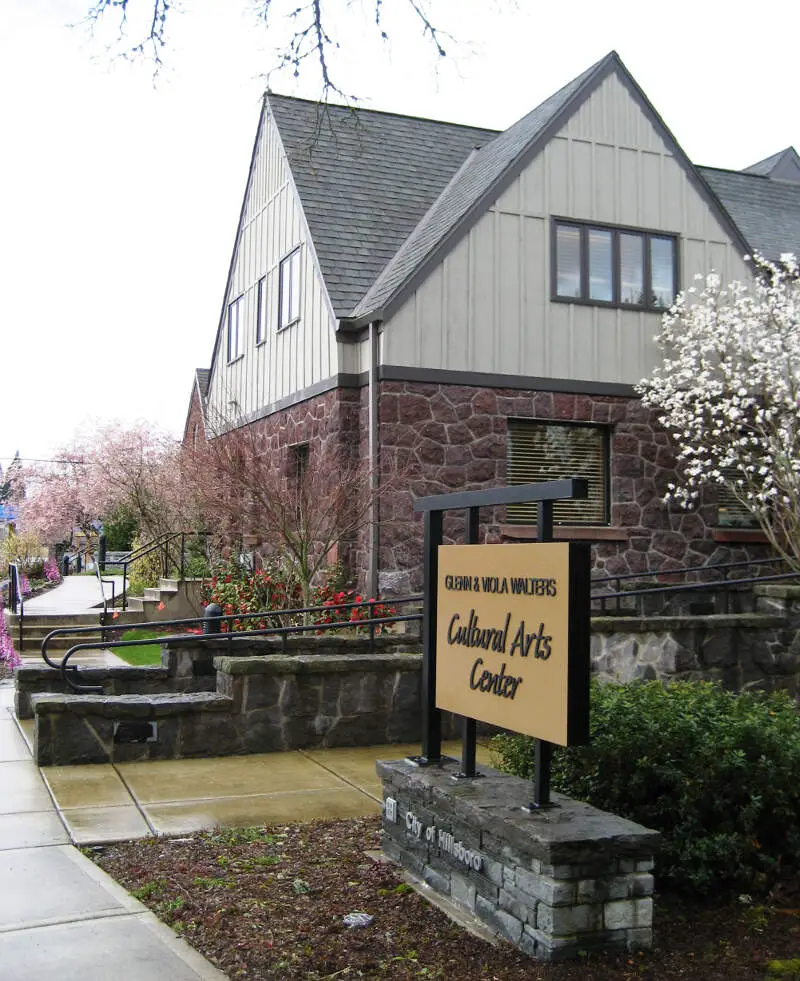
Hillsboro, OR Photos


Rankings for Hillsboro in Oregon


Locations Around Hillsboro
Map Of Hillsboro, OR
Best Places Around Hillsboro
Hazel Dell, WA
Population 22,714
Vancouver, WA
Population 190,700
Lake Oswego, OR
Population 40,457
West Linn, OR
Population 27,167
Sherwood, OR
Population 20,286
Bethany, OR
Population 30,983
Oatfield, OR
Population 13,073
Bull Mountain, OR
Population 9,319
Oak Hills, OR
Population 11,780
Hillsboro Demographics And Statistics
Population over time in Hillsboro
The current population in Hillsboro is 106,612. The population has increased 21.0% from 2010.
| Year | Population | % Change |
|---|---|---|
| 2022 | 106,612 | 1.8% |
| 2021 | 104,730 | 2.3% |
| 2020 | 102,396 | 1.9% |
| 2019 | 100,462 | 2.8% |
| 2018 | 97,751 | 2.1% |
| 2017 | 95,765 | 2.0% |
| 2016 | 93,880 | 2.0% |
| 2015 | 91,998 | 2.3% |
| 2014 | 89,946 | 2.1% |
| 2013 | 88,125 | - |
Race / Ethnicity in Hillsboro
Hillsboro is:
54.1% White with 57,650 White residents.
2.9% African American with 3,100 African American residents.
0.4% American Indian with 419 American Indian residents.
11.5% Asian with 12,213 Asian residents.
0.8% Hawaiian with 864 Hawaiian residents.
0.4% Other with 462 Other residents.
5.9% Two Or More with 6,319 Two Or More residents.
24.0% Hispanic with 25,585 Hispanic residents.
| Race | Hillsboro | OR | USA |
|---|---|---|---|
| White | 54.1% | 73.3% | 58.9% |
| African American | 2.9% | 1.8% | 12.1% |
| American Indian | 0.4% | 0.7% | 0.6% |
| Asian | 11.5% | 4.4% | 5.7% |
| Hawaiian | 0.8% | 0.4% | 0.2% |
| Other | 0.4% | 0.4% | 0.4% |
| Two Or More | 5.9% | 5.2% | 3.5% |
| Hispanic | 24.0% | 13.8% | 18.7% |
Gender in Hillsboro
Hillsboro is 49.5% female with 52,773 female residents.
Hillsboro is 50.5% male with 53,839 male residents.
| Gender | Hillsboro | OR | USA |
|---|---|---|---|
| Female | 49.5% | 50.0% | 50.4% |
| Male | 50.5% | 50.0% | 49.6% |
Highest level of educational attainment in Hillsboro for adults over 25
5.0% of adults in Hillsboro completed < 9th grade.
4.0% of adults in Hillsboro completed 9-12th grade.
18.0% of adults in Hillsboro completed high school / ged.
21.0% of adults in Hillsboro completed some college.
10.0% of adults in Hillsboro completed associate's degree.
23.0% of adults in Hillsboro completed bachelor's degree.
12.0% of adults in Hillsboro completed master's degree.
2.0% of adults in Hillsboro completed professional degree.
5.0% of adults in Hillsboro completed doctorate degree.
| Education | Hillsboro | OR | USA |
|---|---|---|---|
| < 9th Grade | 5.0% | 5.0% | 4.0% |
| 9-12th Grade | 4.0% | 5.0% | 6.0% |
| High School / GED | 18.0% | 22.0% | 26.0% |
| Some College | 21.0% | 24.0% | 20.0% |
| Associate's Degree | 10.0% | 9.0% | 9.0% |
| Bachelor's Degree | 23.0% | 22.0% | 21.0% |
| Master's Degree | 12.0% | 9.0% | 10.0% |
| Professional Degree | 2.0% | 2.0% | 2.0% |
| Doctorate Degree | 5.0% | 2.0% | 2.0% |
Household Income For Hillsboro, Oregon
1.9% of households in Hillsboro earn Less than $10,000.
2.2% of households in Hillsboro earn $10,000 to $14,999.
3.4% of households in Hillsboro earn $15,000 to $24,999.
4.2% of households in Hillsboro earn $25,000 to $34,999.
8.6% of households in Hillsboro earn $35,000 to $49,999.
16.6% of households in Hillsboro earn $50,000 to $74,999.
13.8% of households in Hillsboro earn $75,000 to $99,999.
21.8% of households in Hillsboro earn $100,000 to $149,999.
13.4% of households in Hillsboro earn $150,000 to $199,999.
14.1% of households in Hillsboro earn $200,000 or more.
| Income | Hillsboro | OR | USA |
|---|---|---|---|
| Less than $10,000 | 1.9% | 4.4% | 4.9% |
| $10,000 to $14,999 | 2.2% | 3.5% | 3.8% |
| $15,000 to $24,999 | 3.4% | 6.8% | 7.0% |
| $25,000 to $34,999 | 4.2% | 6.9% | 7.4% |
| $35,000 to $49,999 | 8.6% | 10.9% | 10.7% |
| $50,000 to $74,999 | 16.6% | 16.5% | 16.1% |
| $75,000 to $99,999 | 13.8% | 13.4% | 12.8% |
| $100,000 to $149,999 | 21.8% | 18.0% | 17.1% |
| $150,000 to $199,999 | 13.4% | 9.1% | 8.8% |
| $200,000 or more | 14.1% | 10.5% | 11.4% |


