Woodburn, OR
Demographics And Statistics
Living In Woodburn, Oregon Summary
Life in Woodburn research summary. HomeSnacks has been using Saturday Night Science to research the quality of life in Woodburn over the past nine years using Census, FBI, Zillow, and other primary data sources. Based on the most recently available data, we found the following about life in Woodburn:
The population in Woodburn is 26,222.
The median home value in Woodburn is $403,723.
The median income in Woodburn is $58,916.
The cost of living in Woodburn is 101 which is 1.0x higher than the national average.
The median rent in Woodburn is $1,300.
The unemployment rate in Woodburn is 4.8%.
The poverty rate in Woodburn is 15.4%.
The average high in Woodburn is 63.0° and the average low is 43.5°.
Woodburn SnackAbility
Overall SnackAbility
Woodburn, OR Crime Report
Crime in Woodburn summary. We use data from the FBI to determine the crime rates in Woodburn. Key points include:
There were 1,039 total crimes in Woodburn in the last reporting year.
The overall crime rate per 100,000 people in Woodburn is 3,978.3 / 100k people.
The violent crime rate per 100,000 people in Woodburn is 382.9 / 100k people.
The property crime rate per 100,000 people in Woodburn is 3,595.4 / 100k people.
Overall, crime in Woodburn is 71.17% above the national average.
Total Crimes
Above National Average
Crime In Woodburn Comparison Table
| Statistic | Count Raw |
Woodburn / 100k People |
Oregon / 100k People |
National / 100k People |
|---|---|---|---|---|
| Total Crimes Per 100K | 1,039 | 3,978.3 | 2,950.9 | 2,324.2 |
| Violent Crime | 100 | 382.9 | 291.9 | 369.8 |
| Murder | 0 | 0.0 | 2.9 | 6.3 |
| Robbery | 30 | 114.9 | 51.4 | 66.1 |
| Aggravated Assault | 59 | 225.9 | 200.6 | 268.2 |
| Property Crime | 939 | 3,595.4 | 2,659.0 | 1,954.4 |
| Burglary | 48 | 183.8 | 339.2 | 269.8 |
| Larceny | 717 | 2,745.3 | 1,928.8 | 1,401.9 |
| Car Theft | 174 | 666.2 | 391.0 | 282.7 |
Woodburn, OR Cost Of Living
Cost of living in Woodburn summary. We use data on the cost of living to determine how expensive it is to live in Woodburn. Real estate prices drive most of the variance in cost of living around Oregon. Key points include:
The cost of living in Woodburn is 101 with 100 being average.
The cost of living in Woodburn is 1.0x higher than the national average.
The median home value in Woodburn is $403,723.
The median income in Woodburn is $58,916.
Woodburn's Overall Cost Of Living
Higher Than The National Average
Cost Of Living In Woodburn Comparison Table
| Living Expense | Woodburn | Oregon | National Average | |
|---|---|---|---|---|
| Overall | 101 | 116 | 100 | |
| Services | 112 | 106 | 100 | |
| Groceries | 108 | 107 | 100 | |
| Health | 107 | 103 | 100 | |
| Housing | 83 | 140 | 100 | |
| Transportation | 120 | 117 | 100 | |
| Utilities | 93 | 97 | 100 | |
Woodburn, OR Weather
The average high in Woodburn is 63.0° and the average low is 43.5°.
There are 107.0 days of precipitation each year.
Expect an average of 41.7 inches of precipitation each year with 2.3 inches of snow.
| Stat | Woodburn |
|---|---|
| Average Annual High | 63.0 |
| Average Annual Low | 43.5 |
| Annual Precipitation Days | 107.0 |
| Average Annual Precipitation | 41.7 |
| Average Annual Snowfall | 2.3 |
Average High
Days of Rain
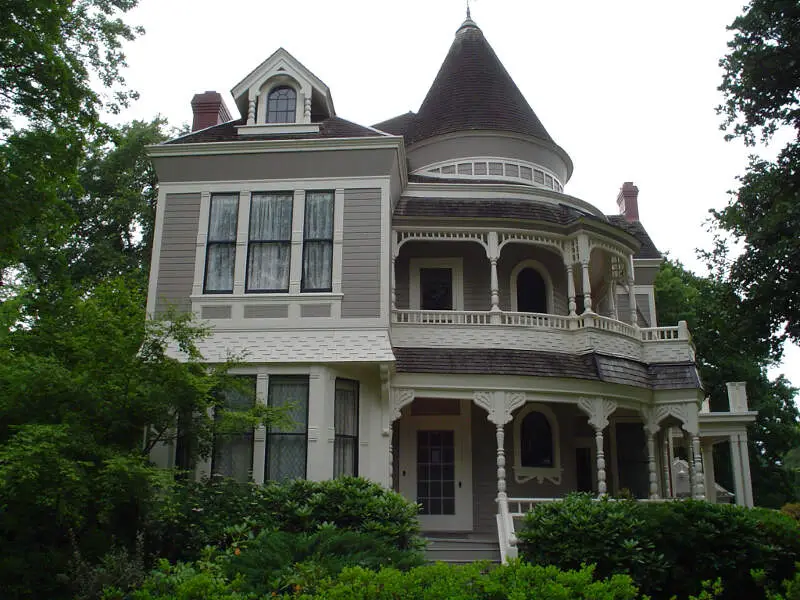
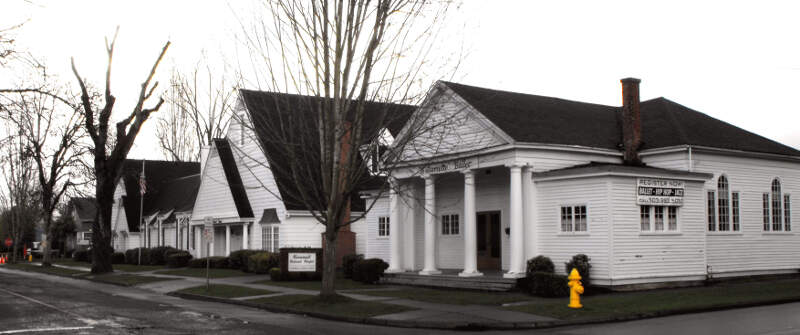
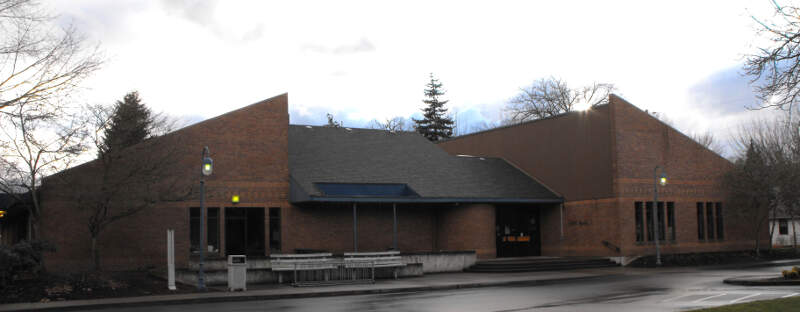
Woodburn, OR Photos


Rankings for Woodburn in Oregon


Locations Around Woodburn
Map Of Woodburn, OR
Best Places Around Woodburn
Oregon, WI
Population 11,240
Keizer, OR
Population 39,122
Lake Oswego, OR
Population 40,457
West Linn, OR
Population 27,167
Sherwood, OR
Population 20,286
Bull Mountain, OR
Population 9,319
Tigard, OR
Population 55,161
Salem, OR
Population 175,754
Canby, OR
Population 18,127
Tualatin, OR
Population 27,804
Woodburn Demographics And Statistics
Population over time in Woodburn
The current population in Woodburn is 26,222. The population has increased 12.8% from 2010.
| Year | Population | % Change |
|---|---|---|
| 2022 | 26,222 | 3.2% |
| 2021 | 25,417 | 1.4% |
| 2020 | 25,067 | 1.2% |
| 2019 | 24,765 | 1.1% |
| 2018 | 24,496 | 0.9% |
| 2017 | 24,282 | 0.8% |
| 2016 | 24,101 | 0.9% |
| 2015 | 23,879 | 0.9% |
| 2014 | 23,665 | 1.8% |
| 2013 | 23,247 | - |
Race / Ethnicity in Woodburn
Woodburn is:
34.2% White with 8,962 White residents.
0.5% African American with 120 African American residents.
0.3% American Indian with 76 American Indian residents.
1.0% Asian with 255 Asian residents.
0.0% Hawaiian with 0 Hawaiian residents.
0.1% Other with 35 Other residents.
2.7% Two Or More with 714 Two Or More residents.
61.2% Hispanic with 16,060 Hispanic residents.
| Race | Woodburn | OR | USA |
|---|---|---|---|
| White | 34.2% | 73.3% | 58.9% |
| African American | 0.5% | 1.8% | 12.1% |
| American Indian | 0.3% | 0.7% | 0.6% |
| Asian | 1.0% | 4.4% | 5.7% |
| Hawaiian | 0.0% | 0.4% | 0.2% |
| Other | 0.1% | 0.4% | 0.4% |
| Two Or More | 2.7% | 5.2% | 3.5% |
| Hispanic | 61.2% | 13.8% | 18.7% |
Gender in Woodburn
Woodburn is 53.1% female with 13,918 female residents.
Woodburn is 46.9% male with 12,304 male residents.
| Gender | Woodburn | OR | USA |
|---|---|---|---|
| Female | 53.1% | 50.0% | 50.4% |
| Male | 46.9% | 50.0% | 49.6% |
Highest level of educational attainment in Woodburn for adults over 25
23.0% of adults in Woodburn completed < 9th grade.
9.0% of adults in Woodburn completed 9-12th grade.
28.0% of adults in Woodburn completed high school / ged.
18.0% of adults in Woodburn completed some college.
7.0% of adults in Woodburn completed associate's degree.
10.0% of adults in Woodburn completed bachelor's degree.
5.0% of adults in Woodburn completed master's degree.
0.0% of adults in Woodburn completed professional degree.
0.0% of adults in Woodburn completed doctorate degree.
| Education | Woodburn | OR | USA |
|---|---|---|---|
| < 9th Grade | 23.0% | 5.0% | 4.0% |
| 9-12th Grade | 9.0% | 5.0% | 6.0% |
| High School / GED | 28.0% | 22.0% | 26.0% |
| Some College | 18.0% | 24.0% | 20.0% |
| Associate's Degree | 7.0% | 9.0% | 9.0% |
| Bachelor's Degree | 10.0% | 22.0% | 21.0% |
| Master's Degree | 5.0% | 9.0% | 10.0% |
| Professional Degree | 0.0% | 2.0% | 2.0% |
| Doctorate Degree | 0.0% | 2.0% | 2.0% |
Household Income For Woodburn, Oregon
3.1% of households in Woodburn earn Less than $10,000.
4.2% of households in Woodburn earn $10,000 to $14,999.
10.8% of households in Woodburn earn $15,000 to $24,999.
8.0% of households in Woodburn earn $25,000 to $34,999.
13.6% of households in Woodburn earn $35,000 to $49,999.
22.2% of households in Woodburn earn $50,000 to $74,999.
9.8% of households in Woodburn earn $75,000 to $99,999.
20.3% of households in Woodburn earn $100,000 to $149,999.
4.2% of households in Woodburn earn $150,000 to $199,999.
3.9% of households in Woodburn earn $200,000 or more.
| Income | Woodburn | OR | USA |
|---|---|---|---|
| Less than $10,000 | 3.1% | 4.4% | 4.9% |
| $10,000 to $14,999 | 4.2% | 3.5% | 3.8% |
| $15,000 to $24,999 | 10.8% | 6.8% | 7.0% |
| $25,000 to $34,999 | 8.0% | 6.9% | 7.4% |
| $35,000 to $49,999 | 13.6% | 10.9% | 10.7% |
| $50,000 to $74,999 | 22.2% | 16.5% | 16.1% |
| $75,000 to $99,999 | 9.8% | 13.4% | 12.8% |
| $100,000 to $149,999 | 20.3% | 18.0% | 17.1% |
| $150,000 to $199,999 | 4.2% | 9.1% | 8.8% |
| $200,000 or more | 3.9% | 10.5% | 11.4% |


