Bellefonte, PA
Demographics And Statistics
Living In Bellefonte, Pennsylvania Summary
Life in Bellefonte research summary. HomeSnacks has been using Saturday Night Science to research the quality of life in Bellefonte over the past nine years using Census, FBI, Zillow, and other primary data sources. Based on the most recently available data, we found the following about life in Bellefonte:
The population in Bellefonte is 6,071.
The median home value in Bellefonte is $277,340.
The median income in Bellefonte is $56,008.
The cost of living in Bellefonte is 98 which is 1.0x lower than the national average.
The median rent in Bellefonte is $907.
The unemployment rate in Bellefonte is 1.1%.
The poverty rate in Bellefonte is 12.6%.
The average high in Bellefonte is 58.7° and the average low is 37.8°.
Table Of Contents
Bellefonte SnackAbility
Overall SnackAbility
Bellefonte, PA Cost Of Living
Cost of living in Bellefonte summary. We use data on the cost of living to determine how expensive it is to live in Bellefonte. Real estate prices drive most of the variance in cost of living around Pennsylvania. Key points include:
The cost of living in Bellefonte is 98 with 100 being average.
The cost of living in Bellefonte is 1.0x lower than the national average.
The median home value in Bellefonte is $277,340.
The median income in Bellefonte is $56,008.
Bellefonte's Overall Cost Of Living
Lower Than The National Average
Cost Of Living In Bellefonte Comparison Table
| Living Expense | Bellefonte | Pennsylvania | National Average | |
|---|---|---|---|---|
| Overall | 98 | 97 | 100 | |
| Services | 104 | 99 | 100 | |
| Groceries | 104 | 101 | 100 | |
| Health | 95 | 97 | 100 | |
| Housing | 89 | 85 | 100 | |
| Transportation | 104 | 105 | 100 | |
| Utilities | 107 | 106 | 100 | |
Bellefonte, PA Weather
The average high in Bellefonte is 58.7° and the average low is 37.8°.
There are 84.7 days of precipitation each year.
Expect an average of 41.3 inches of precipitation each year with 42.1 inches of snow.
| Stat | Bellefonte |
|---|---|
| Average Annual High | 58.7 |
| Average Annual Low | 37.8 |
| Annual Precipitation Days | 84.7 |
| Average Annual Precipitation | 41.3 |
| Average Annual Snowfall | 42.1 |
Average High
Days of Rain
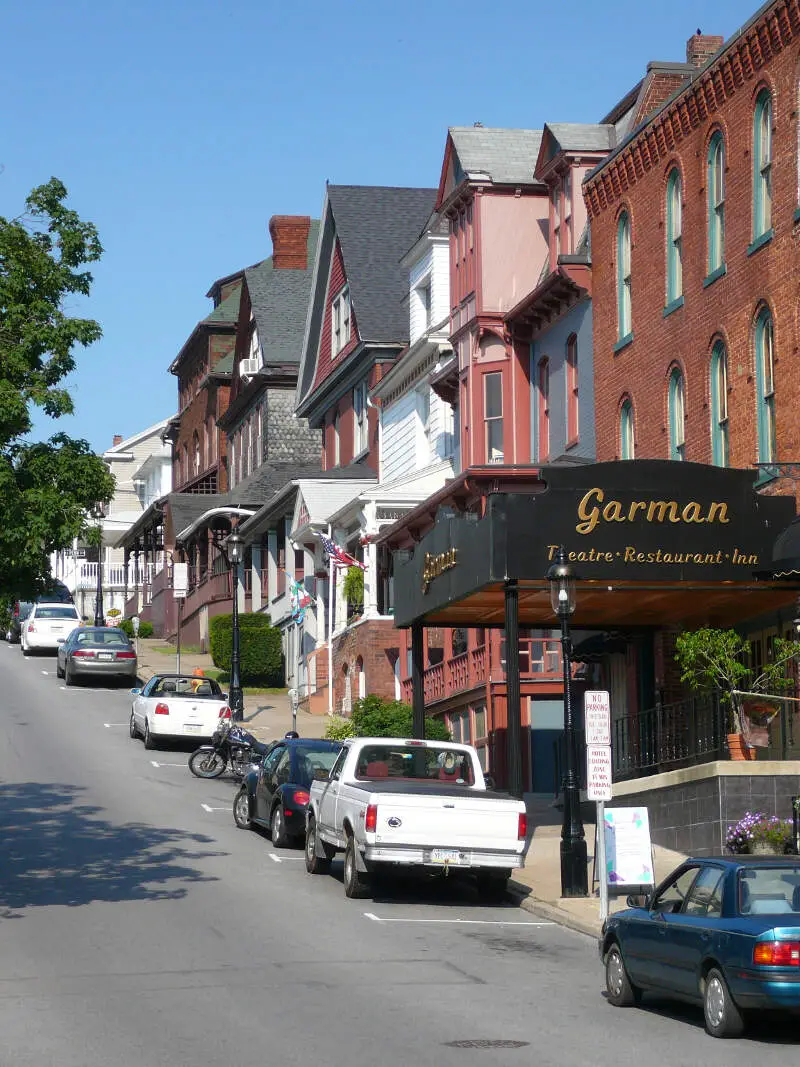
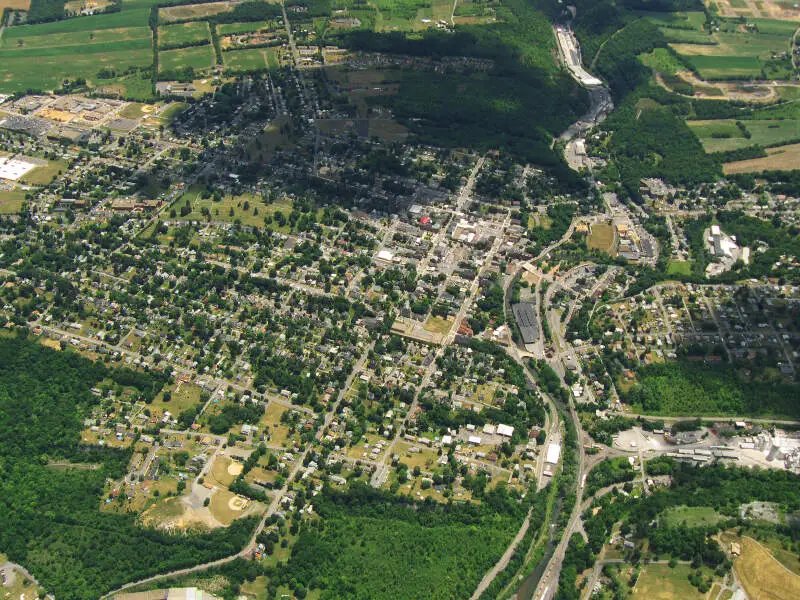
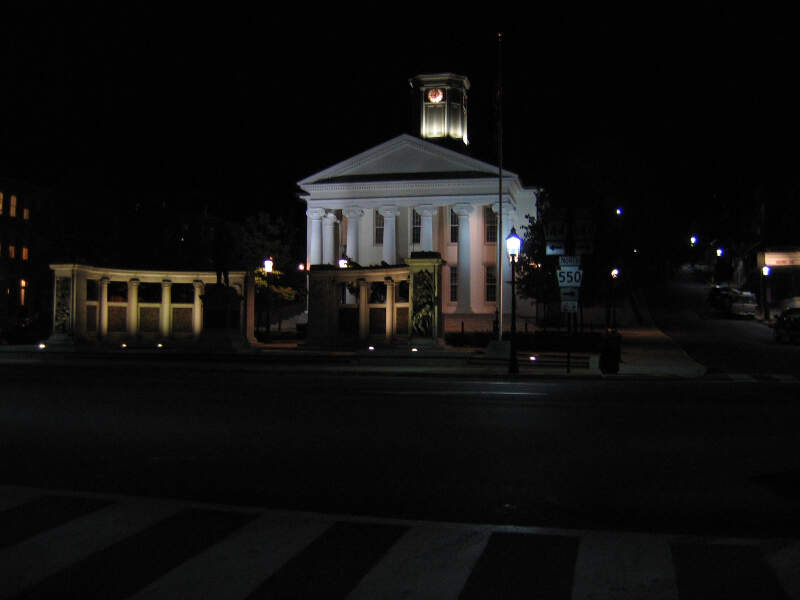
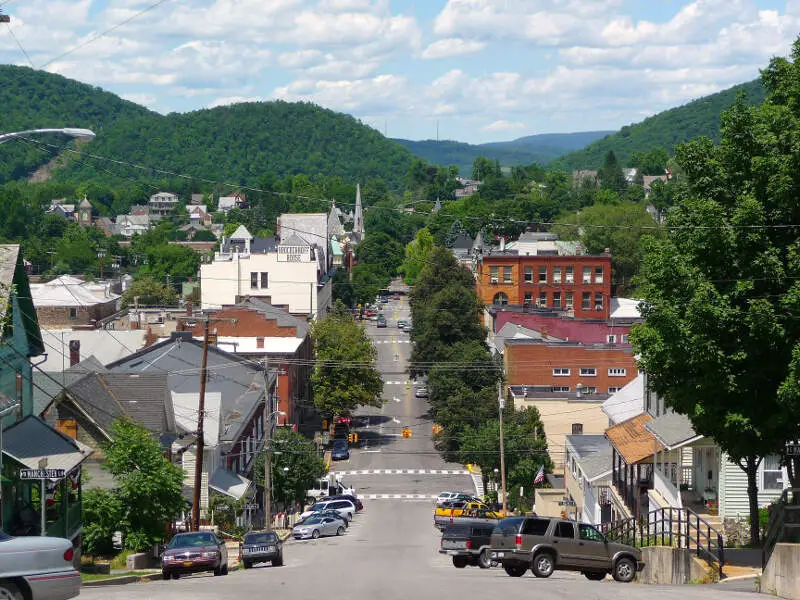
Bellefonte, PA Photos

Rankings for Bellefonte in Pennsylvania


Locations Around Bellefonte
Map Of Bellefonte, PA
Best Places Around Bellefonte
State College, PA
Population 40,902
Prospect Park, PA
Population 406
Lewisburg, PA
Population 5,284
Hollidaysburg, PA
Population 5,630
South Williamsport, PA
Population 6,246
Huntingdon, PA
Population 6,904
Lock Haven, PA
Population 8,422
Tyrone, PA
Population 5,447
Selinsgrove, PA
Population 5,710
Altoona, PA
Population 43,821
Bellefonte Demographics And Statistics
Population over time in Bellefonte
The current population in Bellefonte is 6,071. The population has decreased -2.8% from 2010.
| Year | Population | % Change |
|---|---|---|
| 2022 | 6,071 | -3.5% |
| 2021 | 6,289 | 0.1% |
| 2020 | 6,282 | -0.1% |
| 2019 | 6,287 | 0.0% |
| 2018 | 6,285 | 0.6% |
| 2017 | 6,250 | 0.4% |
| 2016 | 6,228 | -0.3% |
| 2015 | 6,248 | 0.5% |
| 2014 | 6,215 | -0.5% |
| 2013 | 6,247 | - |
Race / Ethnicity in Bellefonte
Bellefonte is:
91.0% White with 5,523 White residents.
2.2% African American with 135 African American residents.
0.0% American Indian with 0 American Indian residents.
2.7% Asian with 162 Asian residents.
0.0% Hawaiian with 0 Hawaiian residents.
0.0% Other with 0 Other residents.
3.2% Two Or More with 193 Two Or More residents.
1.0% Hispanic with 58 Hispanic residents.
| Race | Bellefonte | PA | USA |
|---|---|---|---|
| White | 91.0% | 74.5% | 58.9% |
| African American | 2.2% | 10.4% | 12.1% |
| American Indian | 0.0% | 0.1% | 0.6% |
| Asian | 2.7% | 3.6% | 5.7% |
| Hawaiian | 0.0% | 0.0% | 0.2% |
| Other | 0.0% | 0.4% | 0.4% |
| Two Or More | 3.2% | 3.0% | 3.5% |
| Hispanic | 1.0% | 8.1% | 18.7% |
Gender in Bellefonte
Bellefonte is 50.3% female with 3,051 female residents.
Bellefonte is 49.7% male with 3,019 male residents.
| Gender | Bellefonte | PA | USA |
|---|---|---|---|
| Female | 50.3% | 50.6% | 50.4% |
| Male | 49.7% | 49.4% | 49.6% |
Highest level of educational attainment in Bellefonte for adults over 25
1.0% of adults in Bellefonte completed < 9th grade.
3.0% of adults in Bellefonte completed 9-12th grade.
30.0% of adults in Bellefonte completed high school / ged.
11.0% of adults in Bellefonte completed some college.
13.0% of adults in Bellefonte completed associate's degree.
27.0% of adults in Bellefonte completed bachelor's degree.
9.0% of adults in Bellefonte completed master's degree.
1.0% of adults in Bellefonte completed professional degree.
5.0% of adults in Bellefonte completed doctorate degree.
| Education | Bellefonte | PA | USA |
|---|---|---|---|
| < 9th Grade | 1.0% | 2.0% | 4.0% |
| 9-12th Grade | 3.0% | 5.0% | 6.0% |
| High School / GED | 30.0% | 34.0% | 26.0% |
| Some College | 11.0% | 16.0% | 20.0% |
| Associate's Degree | 13.0% | 9.0% | 9.0% |
| Bachelor's Degree | 27.0% | 20.0% | 21.0% |
| Master's Degree | 9.0% | 10.0% | 10.0% |
| Professional Degree | 1.0% | 2.0% | 2.0% |
| Doctorate Degree | 5.0% | 2.0% | 2.0% |
Household Income For Bellefonte, Pennsylvania
1.6% of households in Bellefonte earn Less than $10,000.
5.2% of households in Bellefonte earn $10,000 to $14,999.
11.3% of households in Bellefonte earn $15,000 to $24,999.
11.2% of households in Bellefonte earn $25,000 to $34,999.
14.4% of households in Bellefonte earn $35,000 to $49,999.
16.4% of households in Bellefonte earn $50,000 to $74,999.
16.1% of households in Bellefonte earn $75,000 to $99,999.
17.4% of households in Bellefonte earn $100,000 to $149,999.
2.5% of households in Bellefonte earn $150,000 to $199,999.
3.9% of households in Bellefonte earn $200,000 or more.
| Income | Bellefonte | PA | USA |
|---|---|---|---|
| Less than $10,000 | 1.6% | 4.8% | 4.9% |
| $10,000 to $14,999 | 5.2% | 3.9% | 3.8% |
| $15,000 to $24,999 | 11.3% | 7.4% | 7.0% |
| $25,000 to $34,999 | 11.2% | 7.6% | 7.4% |
| $35,000 to $49,999 | 14.4% | 11.0% | 10.7% |
| $50,000 to $74,999 | 16.4% | 16.3% | 16.1% |
| $75,000 to $99,999 | 16.1% | 13.0% | 12.8% |
| $100,000 to $149,999 | 17.4% | 17.2% | 17.1% |
| $150,000 to $199,999 | 2.5% | 8.5% | 8.8% |
| $200,000 or more | 3.9% | 10.2% | 11.4% |


