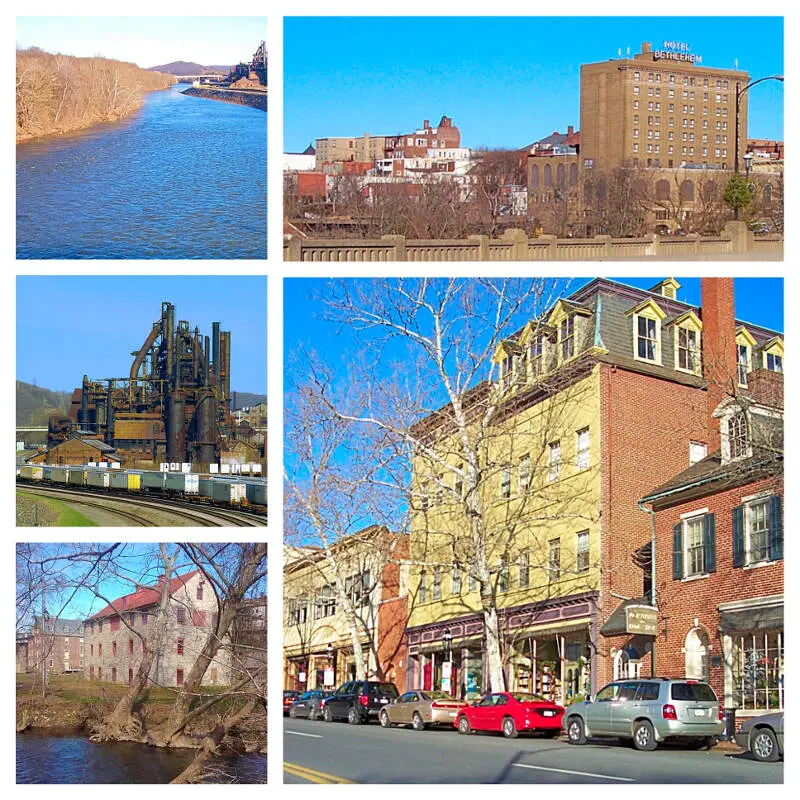
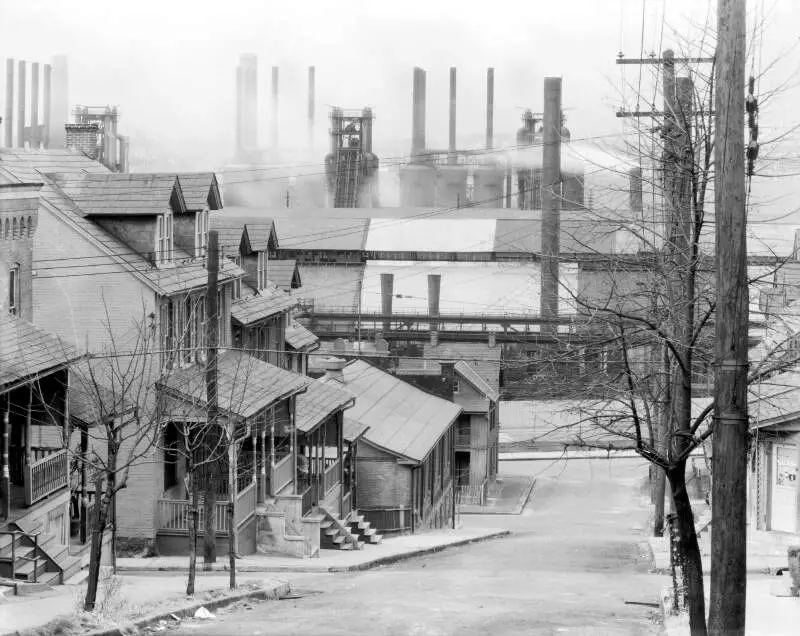
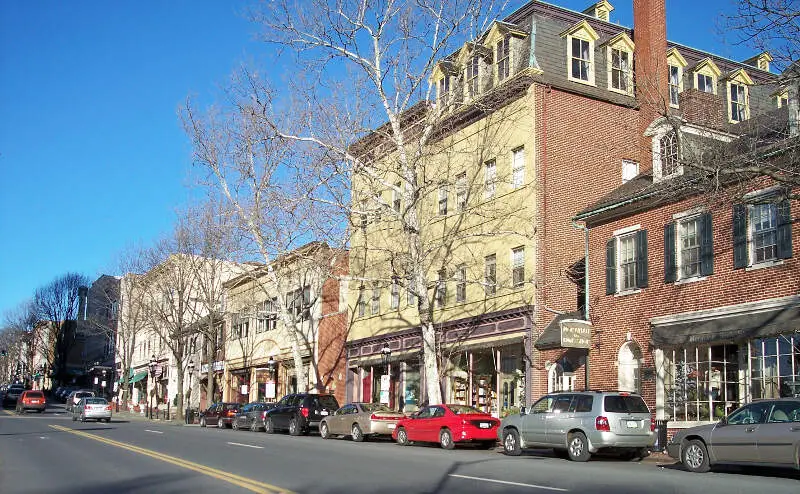
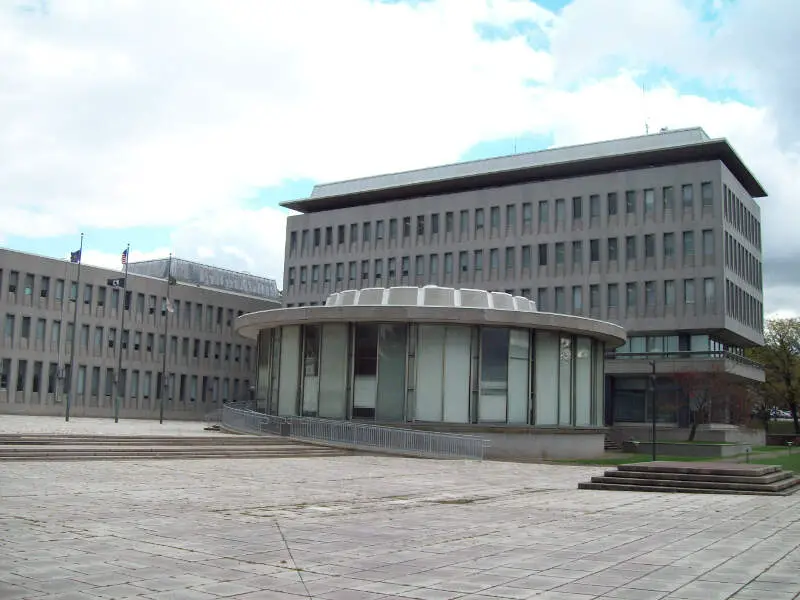
Bethlehem, PA
Demographics And Statistics
Living In Bethlehem, Pennsylvania Summary
Life in Bethlehem research summary. HomeSnacks has been using Saturday Night Science to research the quality of life in Bethlehem over the past nine years using Census, FBI, Zillow, and other primary data sources. Based on the most recently available data, we found the following about life in Bethlehem:
The population in Bethlehem is 76,555.
The median home value in Bethlehem is $311,453.
The median income in Bethlehem is $62,072.
The cost of living in Bethlehem is 101 which is 1.0x higher than the national average.
The median rent in Bethlehem is $1,218.
The unemployment rate in Bethlehem is 5.6%.
The poverty rate in Bethlehem is 18.3%.
The average high in Bethlehem is 61.8° and the average low is 41.6°.
Table Of Contents
Bethlehem SnackAbility
Overall SnackAbility
Bethlehem, PA Cost Of Living
Cost of living in Bethlehem summary. We use data on the cost of living to determine how expensive it is to live in Bethlehem. Real estate prices drive most of the variance in cost of living around Pennsylvania. Key points include:
The cost of living in Bethlehem is 101 with 100 being average.
The cost of living in Bethlehem is 1.0x higher than the national average.
The median home value in Bethlehem is $311,453.
The median income in Bethlehem is $62,072.
Bethlehem's Overall Cost Of Living
Higher Than The National Average
Cost Of Living In Bethlehem Comparison Table
| Living Expense | Bethlehem | Pennsylvania | National Average | |
|---|---|---|---|---|
| Overall | 101 | 97 | 100 | |
| Services | 106 | 99 | 100 | |
| Groceries | 98 | 101 | 100 | |
| Health | 100 | 97 | 100 | |
| Housing | 94 | 85 | 100 | |
| Transportation | 105 | 105 | 100 | |
| Utilities | 100 | 106 | 100 | |
Bethlehem, PA Weather
The average high in Bethlehem is 61.8° and the average low is 41.6°.
There are 79.0 days of precipitation each year.
Expect an average of 44.5 inches of precipitation each year with 33.8 inches of snow.
| Stat | Bethlehem |
|---|---|
| Average Annual High | 61.8 |
| Average Annual Low | 41.6 |
| Annual Precipitation Days | 79.0 |
| Average Annual Precipitation | 44.5 |
| Average Annual Snowfall | 33.8 |
Average High
Days of Rain
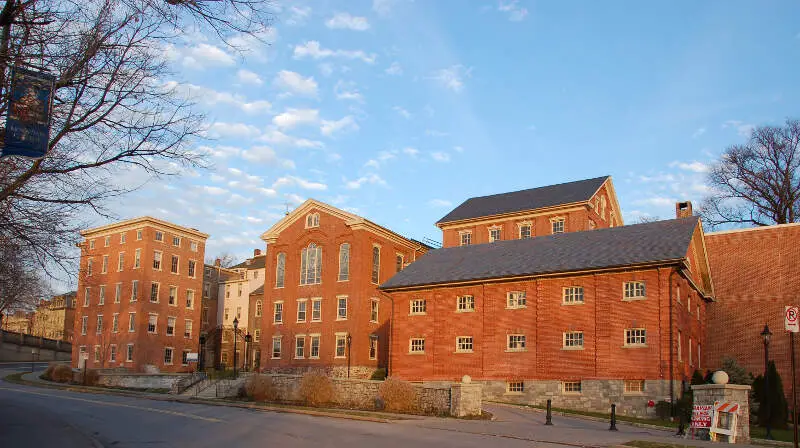
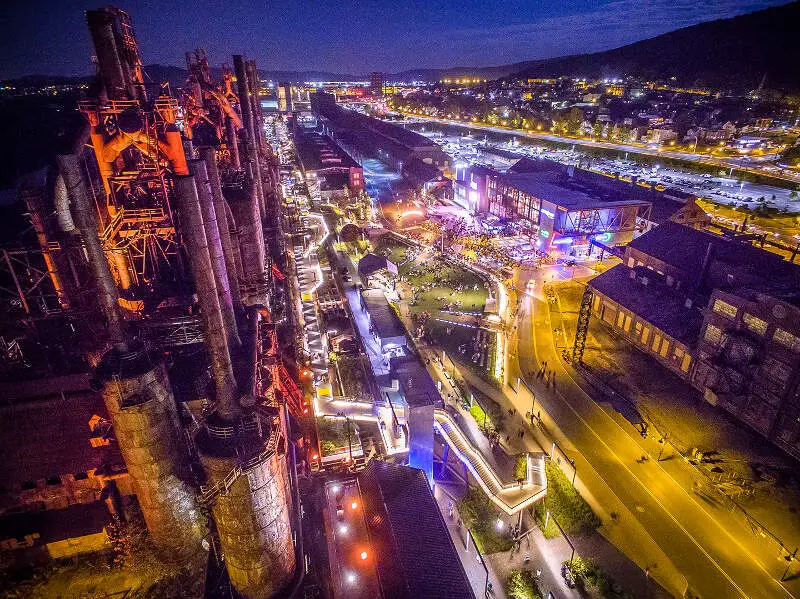
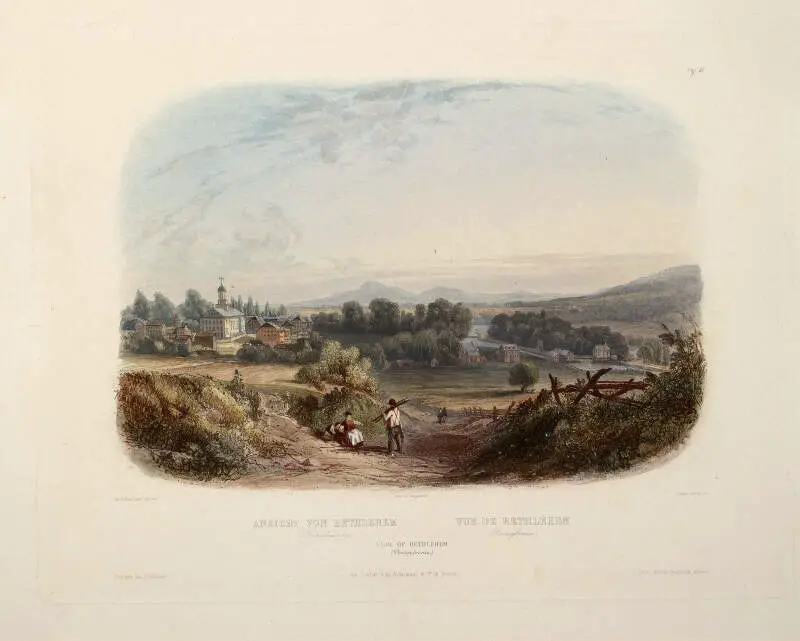
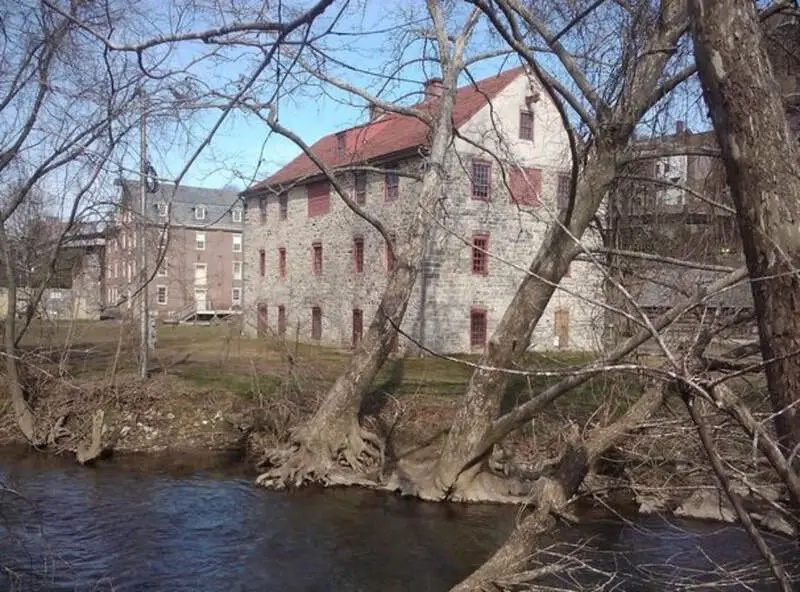
Bethlehem, PA Photos
Rankings for Bethlehem in Pennsylvania


Locations Around Bethlehem
Map Of Bethlehem, PA
Best Places Around Bethlehem
Ancient Oaks, PA
Population 7,363
Middletown, PA
Population 7,245
Middletown, PA
Population 7,245
Wescosville, PA
Population 6,799
Catasauqua, PA
Population 6,512
Perkasie, PA
Population 9,130
Emmaus, PA
Population 11,644
Northampton, PA
Population 10,341
Fullerton, PA
Population 16,358
Nazareth, PA
Population 6,015
Bethlehem Demographics And Statistics
Population over time in Bethlehem
The current population in Bethlehem is 76,555. The population has increased 2.4% from 2010.
| Year | Population | % Change |
|---|---|---|
| 2022 | 76,555 | 1.7% |
| 2021 | 75,296 | 0.1% |
| 2020 | 75,240 | 0.2% |
| 2019 | 75,110 | 0.1% |
| 2018 | 75,004 | -0.1% |
| 2017 | 75,050 | 0.0% |
| 2016 | 75,030 | 0.0% |
| 2015 | 75,016 | 0.1% |
| 2014 | 74,965 | 0.3% |
| 2013 | 74,752 | - |
Race / Ethnicity in Bethlehem
Bethlehem is:
55.0% White with 42,122 White residents.
8.6% African American with 6,605 African American residents.
0.1% American Indian with 64 American Indian residents.
3.1% Asian with 2,367 Asian residents.
0.0% Hawaiian with 18 Hawaiian residents.
0.6% Other with 448 Other residents.
2.4% Two Or More with 1,848 Two Or More residents.
30.2% Hispanic with 23,083 Hispanic residents.
| Race | Bethlehem | PA | USA |
|---|---|---|---|
| White | 55.0% | 74.5% | 58.9% |
| African American | 8.6% | 10.4% | 12.1% |
| American Indian | 0.1% | 0.1% | 0.6% |
| Asian | 3.1% | 3.6% | 5.7% |
| Hawaiian | 0.0% | 0.0% | 0.2% |
| Other | 0.6% | 0.4% | 0.4% |
| Two Or More | 2.4% | 3.0% | 3.5% |
| Hispanic | 30.2% | 8.1% | 18.7% |
Gender in Bethlehem
Bethlehem is 51.6% female with 39,493 female residents.
Bethlehem is 48.4% male with 37,062 male residents.
| Gender | Bethlehem | PA | USA |
|---|---|---|---|
| Female | 51.6% | 50.6% | 50.4% |
| Male | 48.4% | 49.4% | 49.6% |
Highest level of educational attainment in Bethlehem for adults over 25
4.0% of adults in Bethlehem completed < 9th grade.
7.0% of adults in Bethlehem completed 9-12th grade.
30.0% of adults in Bethlehem completed high school / ged.
17.0% of adults in Bethlehem completed some college.
8.0% of adults in Bethlehem completed associate's degree.
20.0% of adults in Bethlehem completed bachelor's degree.
9.0% of adults in Bethlehem completed master's degree.
2.0% of adults in Bethlehem completed professional degree.
3.0% of adults in Bethlehem completed doctorate degree.
| Education | Bethlehem | PA | USA |
|---|---|---|---|
| < 9th Grade | 4.0% | 2.0% | 4.0% |
| 9-12th Grade | 7.0% | 5.0% | 6.0% |
| High School / GED | 30.0% | 34.0% | 26.0% |
| Some College | 17.0% | 16.0% | 20.0% |
| Associate's Degree | 8.0% | 9.0% | 9.0% |
| Bachelor's Degree | 20.0% | 20.0% | 21.0% |
| Master's Degree | 9.0% | 10.0% | 10.0% |
| Professional Degree | 2.0% | 2.0% | 2.0% |
| Doctorate Degree | 3.0% | 2.0% | 2.0% |
Household Income For Bethlehem, Pennsylvania
4.3% of households in Bethlehem earn Less than $10,000.
5.2% of households in Bethlehem earn $10,000 to $14,999.
8.9% of households in Bethlehem earn $15,000 to $24,999.
9.7% of households in Bethlehem earn $25,000 to $34,999.
13.7% of households in Bethlehem earn $35,000 to $49,999.
15.9% of households in Bethlehem earn $50,000 to $74,999.
12.9% of households in Bethlehem earn $75,000 to $99,999.
16.2% of households in Bethlehem earn $100,000 to $149,999.
6.3% of households in Bethlehem earn $150,000 to $199,999.
6.9% of households in Bethlehem earn $200,000 or more.
| Income | Bethlehem | PA | USA |
|---|---|---|---|
| Less than $10,000 | 4.3% | 4.8% | 4.9% |
| $10,000 to $14,999 | 5.2% | 3.9% | 3.8% |
| $15,000 to $24,999 | 8.9% | 7.4% | 7.0% |
| $25,000 to $34,999 | 9.7% | 7.6% | 7.4% |
| $35,000 to $49,999 | 13.7% | 11.0% | 10.7% |
| $50,000 to $74,999 | 15.9% | 16.3% | 16.1% |
| $75,000 to $99,999 | 12.9% | 13.0% | 12.8% |
| $100,000 to $149,999 | 16.2% | 17.2% | 17.1% |
| $150,000 to $199,999 | 6.3% | 8.5% | 8.8% |
| $200,000 or more | 6.9% | 10.2% | 11.4% |


