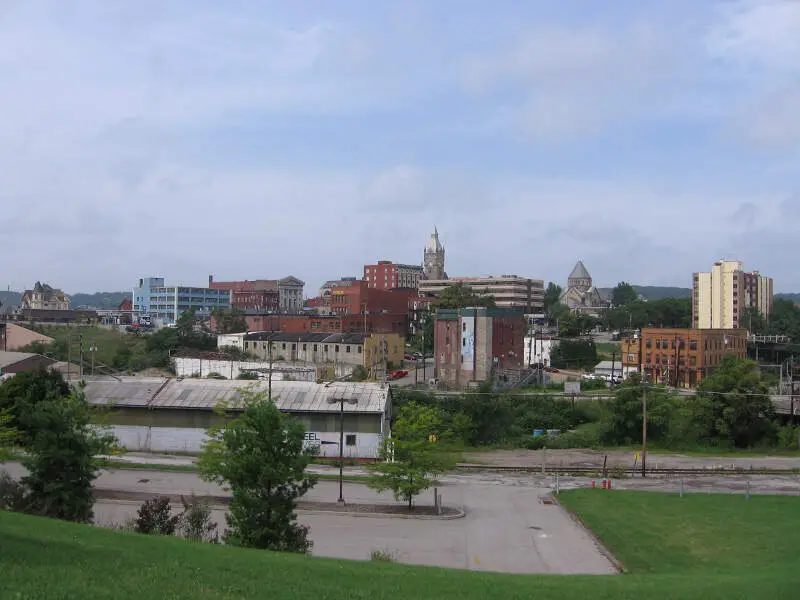
Butler, PA
Demographics And Statistics
Living In Butler, Pennsylvania Summary
Life in Butler research summary. HomeSnacks has been using Saturday Night Science to research the quality of life in Butler over the past nine years using Census, FBI, Zillow, and other primary data sources. Based on the most recently available data, we found the following about life in Butler:
The population in Butler is 13,387.
The median home value in Butler is $229,441.
The median income in Butler is $39,546.
The cost of living in Butler is 87 which is 0.9x lower than the national average.
The median rent in Butler is $771.
The unemployment rate in Butler is 9.4%.
The poverty rate in Butler is 21.7%.
The average high in Butler is 60.4° and the average low is 38.9°.
Butler SnackAbility
Overall SnackAbility
Butler, PA Crime Report
Crime in Butler summary. We use data from the FBI to determine the crime rates in Butler. Key points include:
There were 330 total crimes in Butler in the last reporting year.
The overall crime rate per 100,000 people in Butler is 2,557.9 / 100k people.
The violent crime rate per 100,000 people in Butler is 480.6 / 100k people.
The property crime rate per 100,000 people in Butler is 2,077.4 / 100k people.
Overall, crime in Butler is 10.06% above the national average.
Total Crimes
Above National Average
Crime In Butler Comparison Table
| Statistic | Count Raw |
Butler / 100k People |
Pennsylvania / 100k People |
National / 100k People |
|---|---|---|---|---|
| Total Crimes Per 100K | 330 | 2,557.9 | 2,033.6 | 2,324.2 |
| Violent Crime | 62 | 480.6 | 389.5 | 369.8 |
| Murder | 0 | 0.0 | 7.9 | 6.3 |
| Robbery | 9 | 69.8 | 83.9 | 66.1 |
| Aggravated Assault | 55 | 426.3 | 264.6 | 268.2 |
| Property Crime | 268 | 2,077.4 | 1,644.1 | 1,954.4 |
| Burglary | 51 | 395.3 | 248.6 | 269.8 |
| Larceny | 205 | 1,589.0 | 1,274.5 | 1,401.9 |
| Car Theft | 12 | 93.0 | 121.0 | 282.7 |
Butler, PA Cost Of Living
Cost of living in Butler summary. We use data on the cost of living to determine how expensive it is to live in Butler. Real estate prices drive most of the variance in cost of living around Pennsylvania. Key points include:
The cost of living in Butler is 87 with 100 being average.
The cost of living in Butler is 0.9x lower than the national average.
The median home value in Butler is $229,441.
The median income in Butler is $39,546.
Butler's Overall Cost Of Living
Lower Than The National Average
Cost Of Living In Butler Comparison Table
| Living Expense | Butler | Pennsylvania | National Average | |
|---|---|---|---|---|
| Overall | 87 | 97 | 100 | |
| Services | 96 | 99 | 100 | |
| Groceries | 110 | 101 | 100 | |
| Health | 96 | 97 | 100 | |
| Housing | 54 | 85 | 100 | |
| Transportation | 104 | 105 | 100 | |
| Utilities | 133 | 106 | 100 | |
Butler, PA Weather
The average high in Butler is 60.4° and the average low is 38.9°.
There are 88.8 days of precipitation each year.
Expect an average of 40.4 inches of precipitation each year with 34.9 inches of snow.
| Stat | Butler |
|---|---|
| Average Annual High | 60.4 |
| Average Annual Low | 38.9 |
| Annual Precipitation Days | 88.8 |
| Average Annual Precipitation | 40.4 |
| Average Annual Snowfall | 34.9 |
Average High
Days of Rain
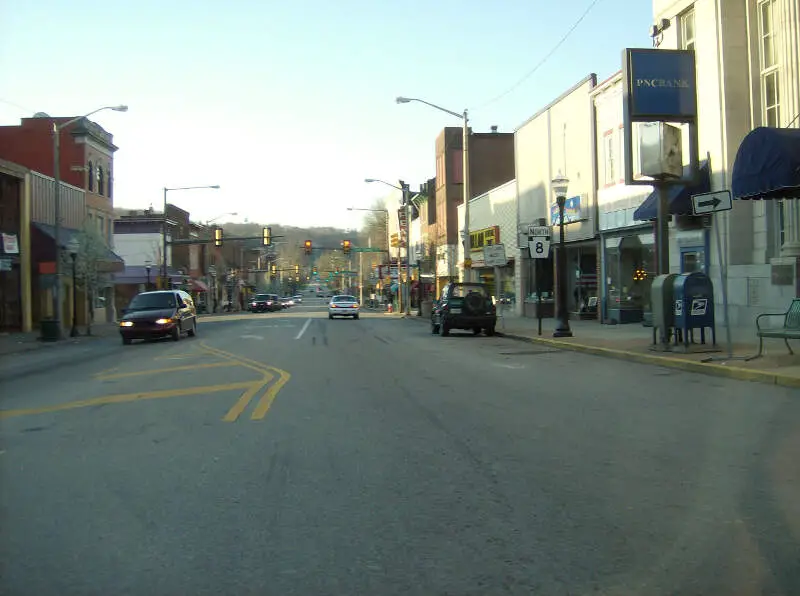
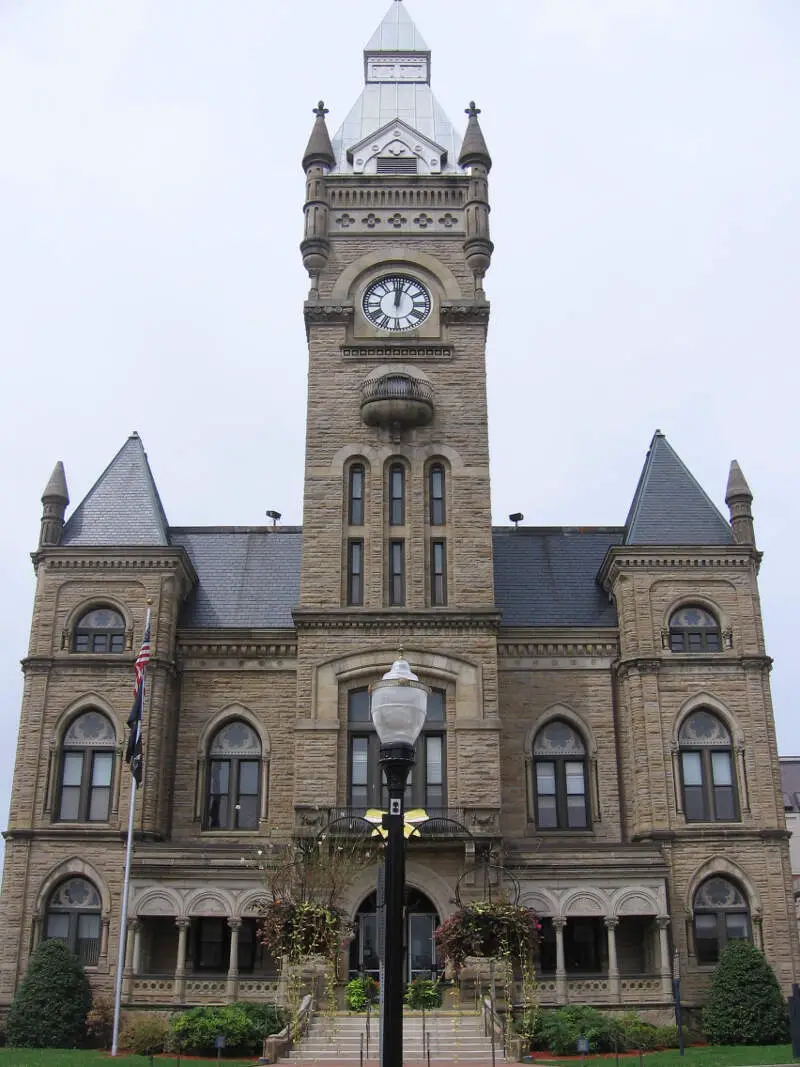
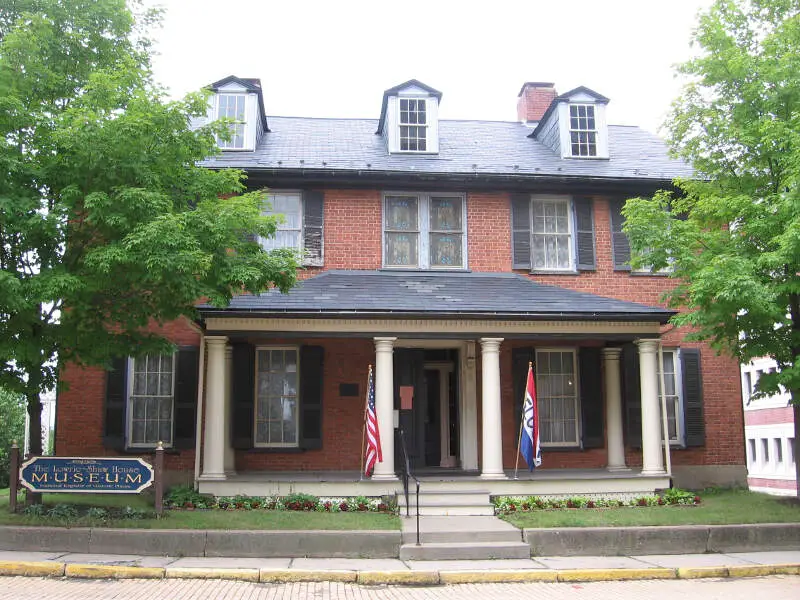
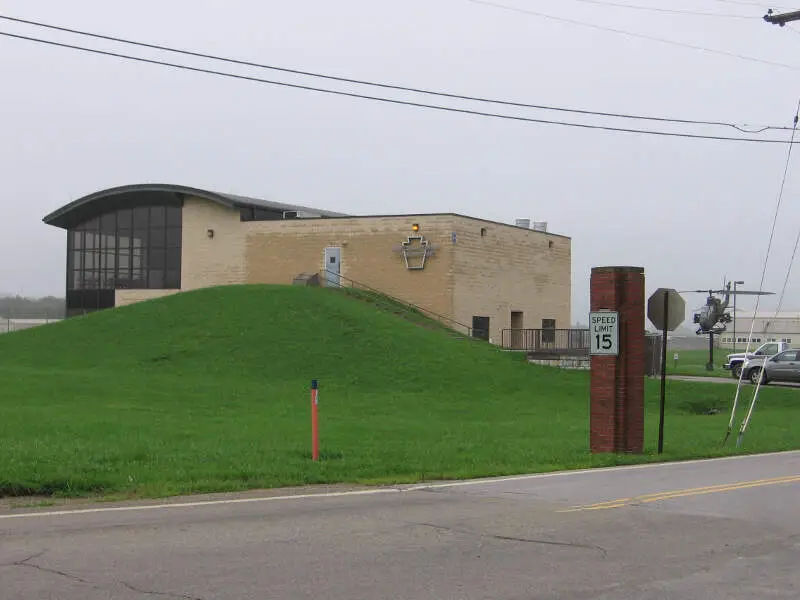
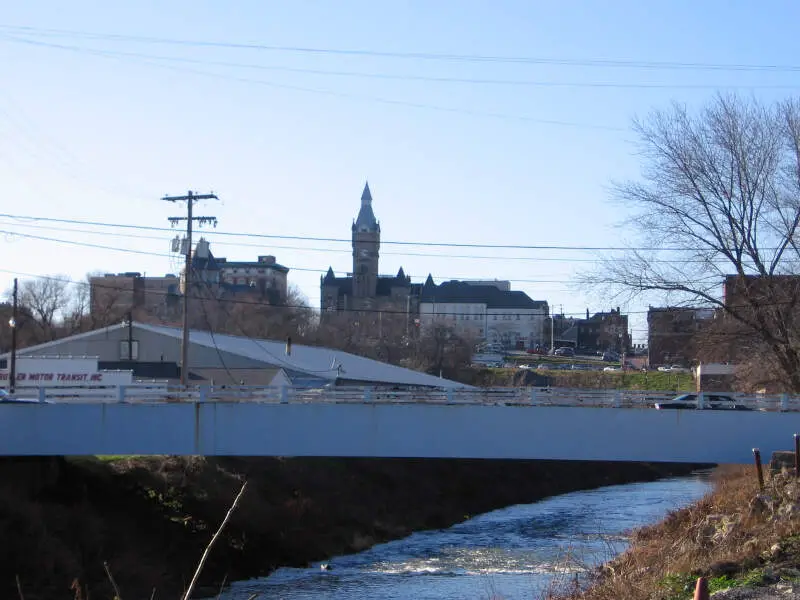
Butler, PA Photos
Rankings for Butler in Pennsylvania


Locations Around Butler
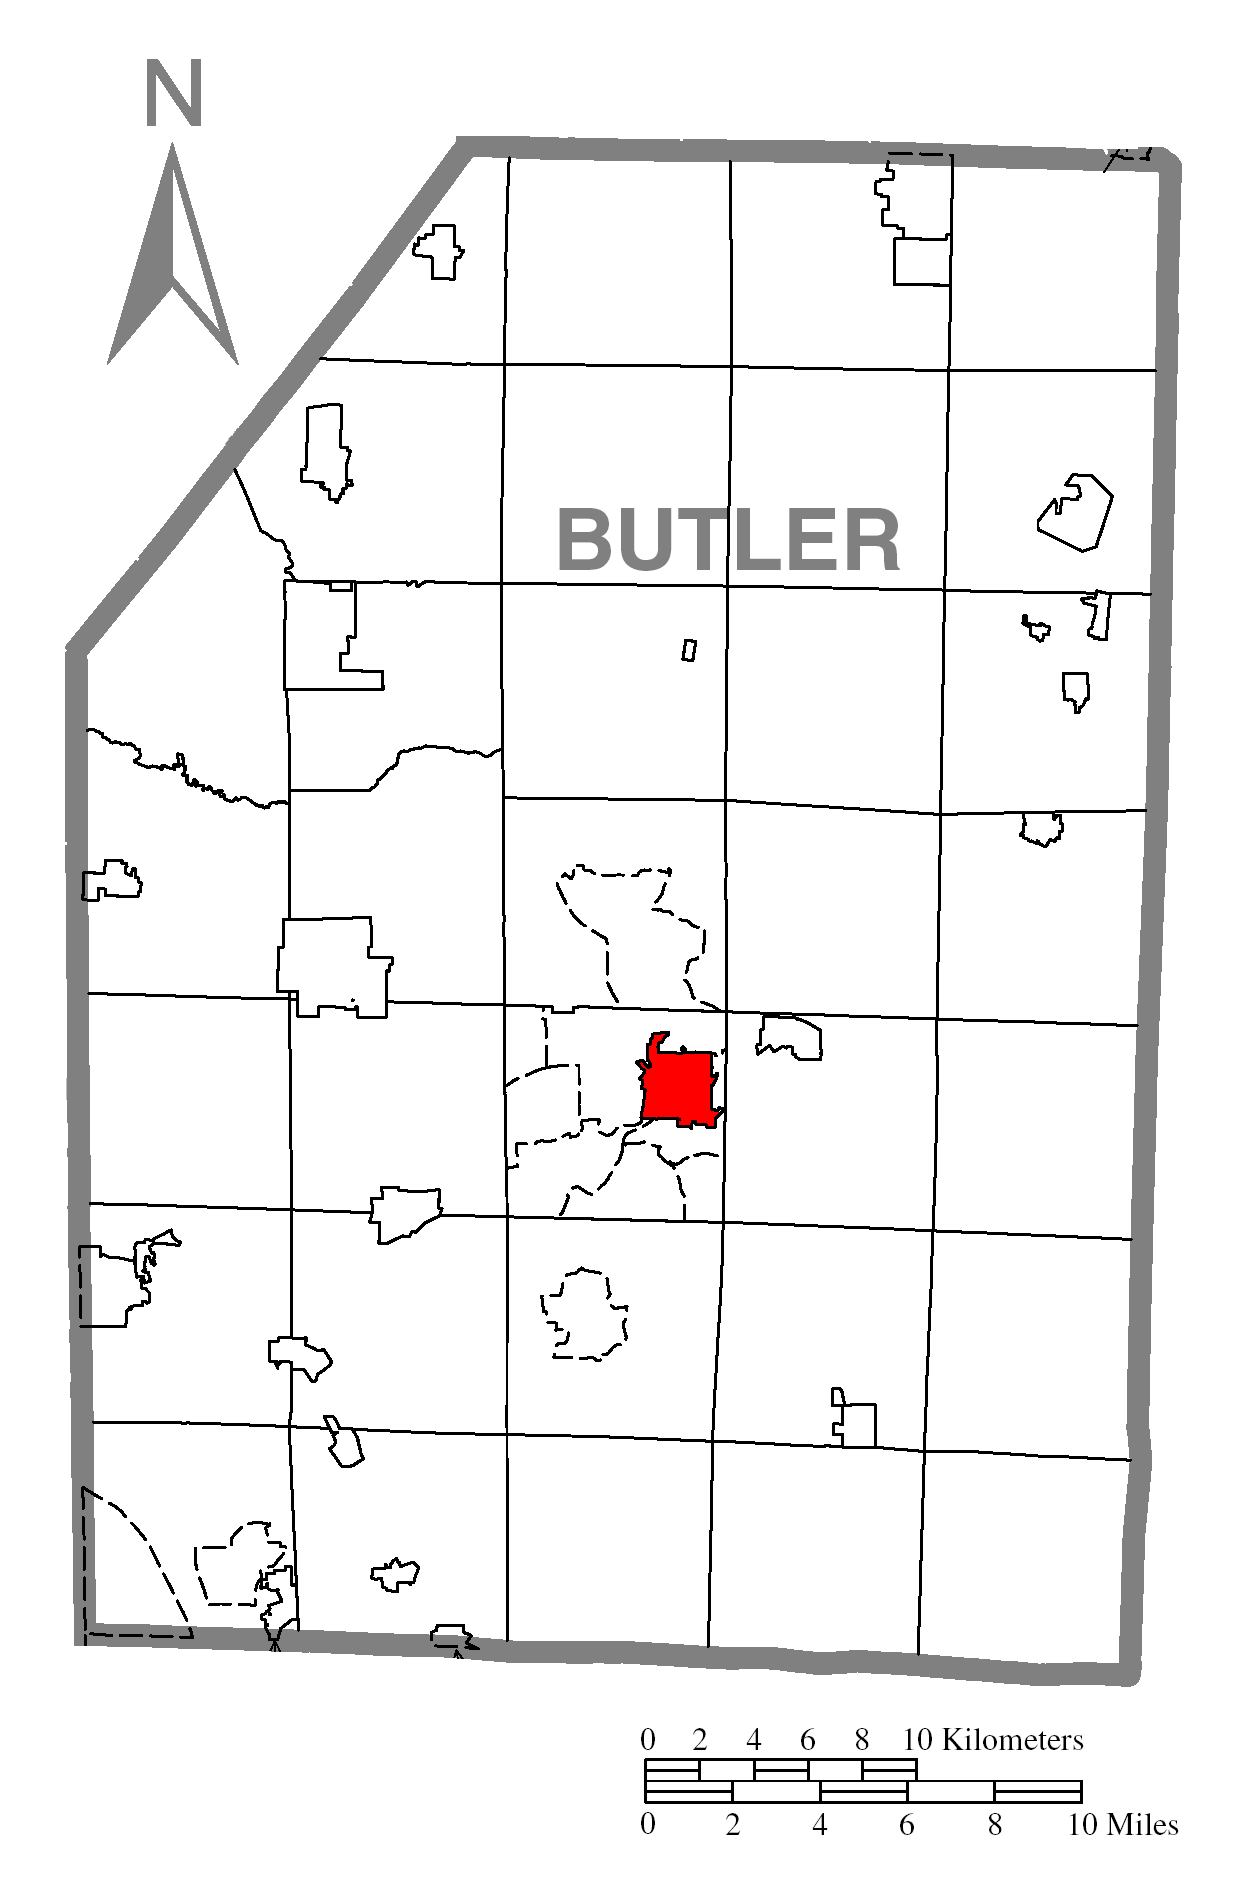
Map Of Butler, PA
Best Places Around Butler
Canfield, OH
Population 7,662
Fox Chapel, PA
Population 5,299
Glenshaw, PA
Population 9,418
Franklin Park, PA
Population 15,305
Allison Park, PA
Population 22,701
Pleasant Hills, PA
Population 8,456
Forest Hills, PA
Population 6,397
Dormont, PA
Population 8,199
Castle Shannon, PA
Population 8,283
Butler Demographics And Statistics
Population over time in Butler
The current population in Butler is 13,387. The population has decreased -4.6% from 2010.
| Year | Population | % Change |
|---|---|---|
| 2022 | 13,387 | 1.6% |
| 2021 | 13,182 | -0.8% |
| 2020 | 13,292 | -0.8% |
| 2019 | 13,399 | -0.9% |
| 2018 | 13,517 | -0.7% |
| 2017 | 13,609 | -0.7% |
| 2016 | 13,701 | -0.7% |
| 2015 | 13,798 | -1.0% |
| 2014 | 13,943 | -0.7% |
| 2013 | 14,035 | - |
Race / Ethnicity in Butler
Butler is:
88.1% White with 11,796 White residents.
2.7% African American with 355 African American residents.
0.0% American Indian with 0 American Indian residents.
0.5% Asian with 67 Asian residents.
0.0% Hawaiian with 0 Hawaiian residents.
0.8% Other with 113 Other residents.
5.0% Two Or More with 674 Two Or More residents.
2.9% Hispanic with 382 Hispanic residents.
| Race | Butler | PA | USA |
|---|---|---|---|
| White | 88.1% | 74.5% | 58.9% |
| African American | 2.7% | 10.4% | 12.1% |
| American Indian | 0.0% | 0.1% | 0.6% |
| Asian | 0.5% | 3.6% | 5.7% |
| Hawaiian | 0.0% | 0.0% | 0.2% |
| Other | 0.8% | 0.4% | 0.4% |
| Two Or More | 5.0% | 3.0% | 3.5% |
| Hispanic | 2.9% | 8.1% | 18.7% |
Gender in Butler
Butler is 49.2% female with 6,588 female residents.
Butler is 50.8% male with 6,798 male residents.
| Gender | Butler | PA | USA |
|---|---|---|---|
| Female | 49.2% | 50.6% | 50.4% |
| Male | 50.8% | 49.4% | 49.6% |
Highest level of educational attainment in Butler for adults over 25
2.0% of adults in Butler completed < 9th grade.
6.0% of adults in Butler completed 9-12th grade.
41.0% of adults in Butler completed high school / ged.
18.0% of adults in Butler completed some college.
12.0% of adults in Butler completed associate's degree.
17.0% of adults in Butler completed bachelor's degree.
4.0% of adults in Butler completed master's degree.
0.0% of adults in Butler completed professional degree.
0.0% of adults in Butler completed doctorate degree.
| Education | Butler | PA | USA |
|---|---|---|---|
| < 9th Grade | 2.0% | 2.0% | 4.0% |
| 9-12th Grade | 6.0% | 5.0% | 6.0% |
| High School / GED | 41.0% | 34.0% | 26.0% |
| Some College | 18.0% | 16.0% | 20.0% |
| Associate's Degree | 12.0% | 9.0% | 9.0% |
| Bachelor's Degree | 17.0% | 20.0% | 21.0% |
| Master's Degree | 4.0% | 10.0% | 10.0% |
| Professional Degree | 0.0% | 2.0% | 2.0% |
| Doctorate Degree | 0.0% | 2.0% | 2.0% |
Household Income For Butler, Pennsylvania
5.9% of households in Butler earn Less than $10,000.
12.3% of households in Butler earn $10,000 to $14,999.
14.9% of households in Butler earn $15,000 to $24,999.
12.5% of households in Butler earn $25,000 to $34,999.
12.5% of households in Butler earn $35,000 to $49,999.
17.9% of households in Butler earn $50,000 to $74,999.
8.8% of households in Butler earn $75,000 to $99,999.
8.6% of households in Butler earn $100,000 to $149,999.
3.0% of households in Butler earn $150,000 to $199,999.
3.5% of households in Butler earn $200,000 or more.
| Income | Butler | PA | USA |
|---|---|---|---|
| Less than $10,000 | 5.9% | 4.8% | 4.9% |
| $10,000 to $14,999 | 12.3% | 3.9% | 3.8% |
| $15,000 to $24,999 | 14.9% | 7.4% | 7.0% |
| $25,000 to $34,999 | 12.5% | 7.6% | 7.4% |
| $35,000 to $49,999 | 12.5% | 11.0% | 10.7% |
| $50,000 to $74,999 | 17.9% | 16.3% | 16.1% |
| $75,000 to $99,999 | 8.8% | 13.0% | 12.8% |
| $100,000 to $149,999 | 8.6% | 17.2% | 17.1% |
| $150,000 to $199,999 | 3.0% | 8.5% | 8.8% |
| $200,000 or more | 3.5% | 10.2% | 11.4% |


