Chester, PA
Demographics And Statistics
Living In Chester, Pennsylvania Summary
Life in Chester research summary. HomeSnacks has been using Saturday Night Science to research the quality of life in Chester over the past nine years using Census, FBI, Zillow, and other primary data sources. Based on the most recently available data, we found the following about life in Chester:
The population in Chester is 33,048.
The median home value in Chester is $91,695.
The median income in Chester is $39,193.
The cost of living in Chester is 93 which is 0.9x lower than the national average.
The median rent in Chester is $996.
The unemployment rate in Chester is 15.9%.
The poverty rate in Chester is 28.3%.
The average high in Chester is 64.4° and the average low is 47.6°.
Chester SnackAbility
Overall SnackAbility
Chester, PA Crime Report
Crime in Chester summary. We use data from the FBI to determine the crime rates in Chester. Key points include:
There were 1,789 total crimes in Chester in the last reporting year.
The overall crime rate per 100,000 people in Chester is 5,276.5 / 100k people.
The violent crime rate per 100,000 people in Chester is 1,757.9 / 100k people.
The property crime rate per 100,000 people in Chester is 3,518.7 / 100k people.
Overall, crime in Chester is 127.03% above the national average.
Total Crimes
Above National Average
Crime In Chester Comparison Table
| Statistic | Count Raw |
Chester / 100k People |
Pennsylvania / 100k People |
National / 100k People |
|---|---|---|---|---|
| Total Crimes Per 100K | 1,789 | 5,276.5 | 2,033.6 | 2,324.2 |
| Violent Crime | 596 | 1,757.9 | 389.5 | 369.8 |
| Murder | 27 | 79.6 | 7.9 | 6.3 |
| Robbery | 156 | 460.1 | 83.9 | 66.1 |
| Aggravated Assault | 387 | 1,141.4 | 264.6 | 268.2 |
| Property Crime | 1,193 | 3,518.7 | 1,644.1 | 1,954.4 |
| Burglary | 346 | 1,020.5 | 248.6 | 269.8 |
| Larceny | 676 | 1,993.8 | 1,274.5 | 1,401.9 |
| Car Theft | 210 | 619.4 | 121.0 | 282.7 |
Chester, PA Cost Of Living
Cost of living in Chester summary. We use data on the cost of living to determine how expensive it is to live in Chester. Real estate prices drive most of the variance in cost of living around Pennsylvania. Key points include:
The cost of living in Chester is 93 with 100 being average.
The cost of living in Chester is 0.9x lower than the national average.
The median home value in Chester is $91,695.
The median income in Chester is $39,193.
Chester's Overall Cost Of Living
Lower Than The National Average
Cost Of Living In Chester Comparison Table
| Living Expense | Chester | Pennsylvania | National Average | |
|---|---|---|---|---|
| Overall | 93 | 97 | 100 | |
| Services | 114 | 99 | 100 | |
| Groceries | 112 | 101 | 100 | |
| Health | 117 | 97 | 100 | |
| Housing | 49 | 85 | 100 | |
| Transportation | 113 | 105 | 100 | |
| Utilities | 87 | 106 | 100 | |
Chester, PA Weather
The average high in Chester is 64.4° and the average low is 47.6°.
There are 63.5 days of precipitation each year.
Expect an average of 43.6 inches of precipitation each year with 11.8 inches of snow.
| Stat | Chester |
|---|---|
| Average Annual High | 64.4 |
| Average Annual Low | 47.6 |
| Annual Precipitation Days | 63.5 |
| Average Annual Precipitation | 43.6 |
| Average Annual Snowfall | 11.8 |
Average High
Days of Rain
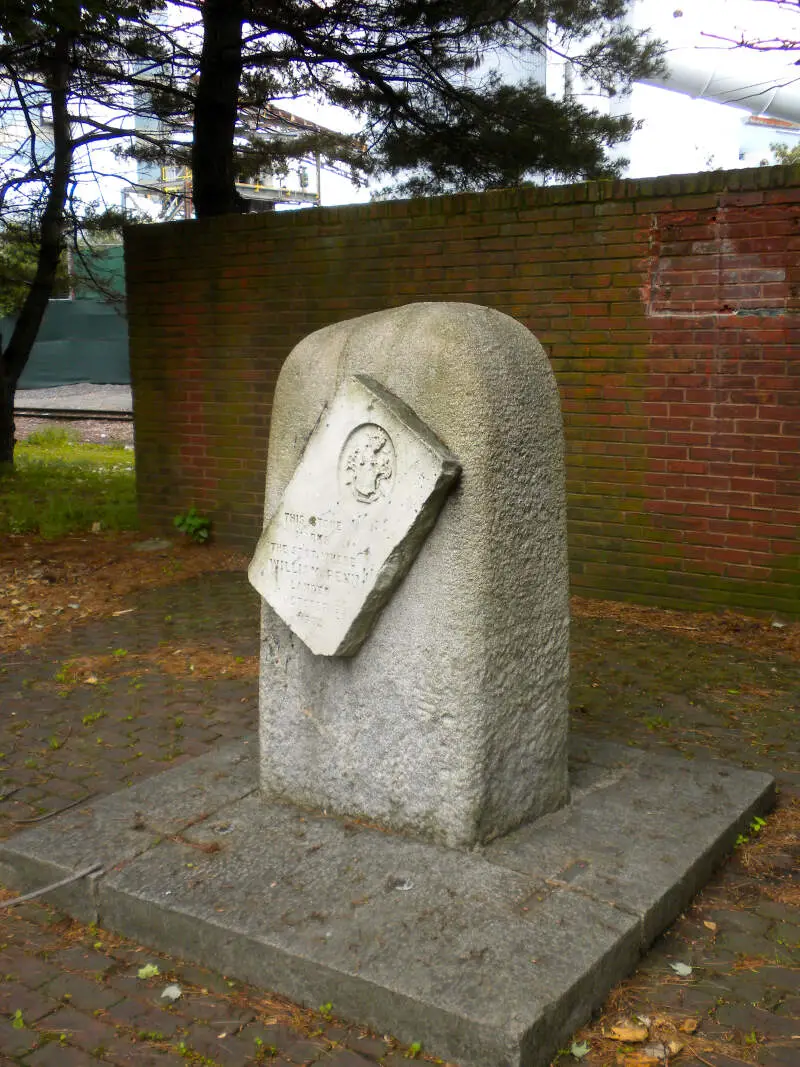
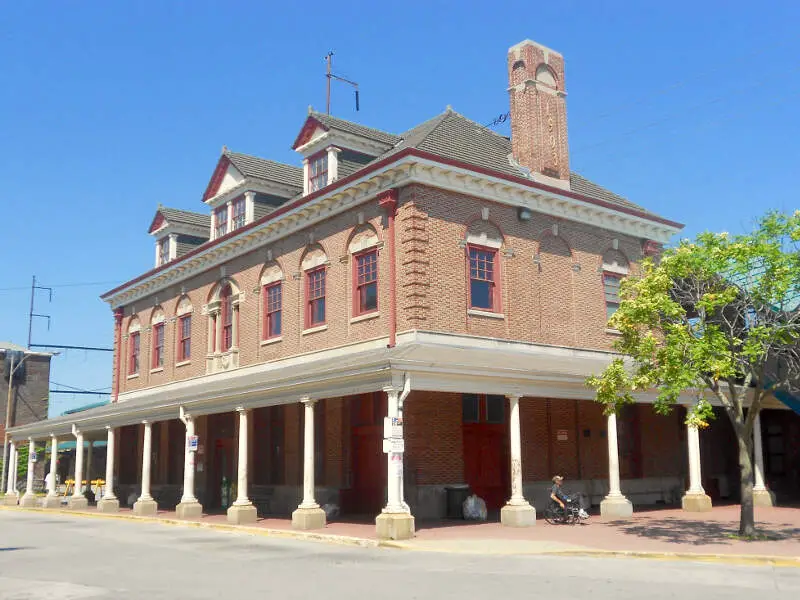
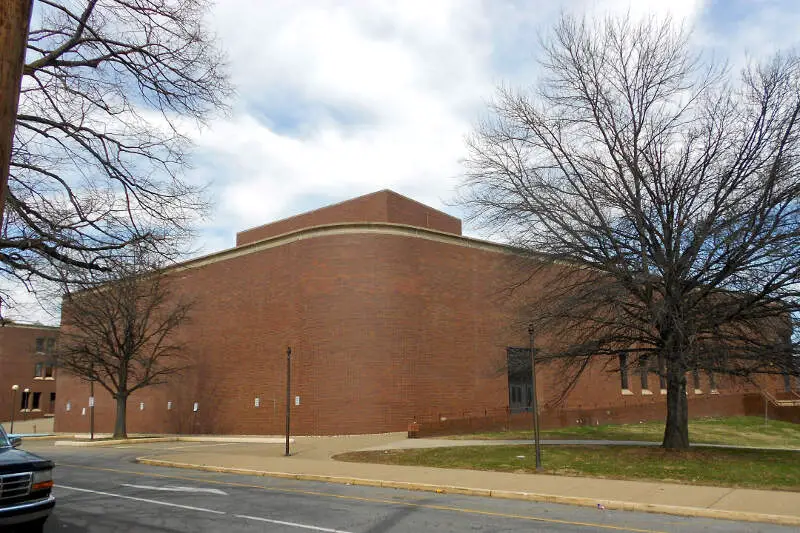
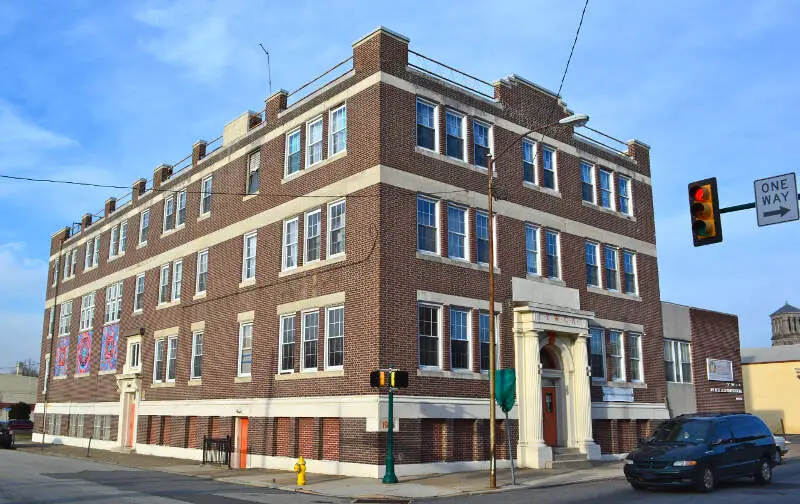
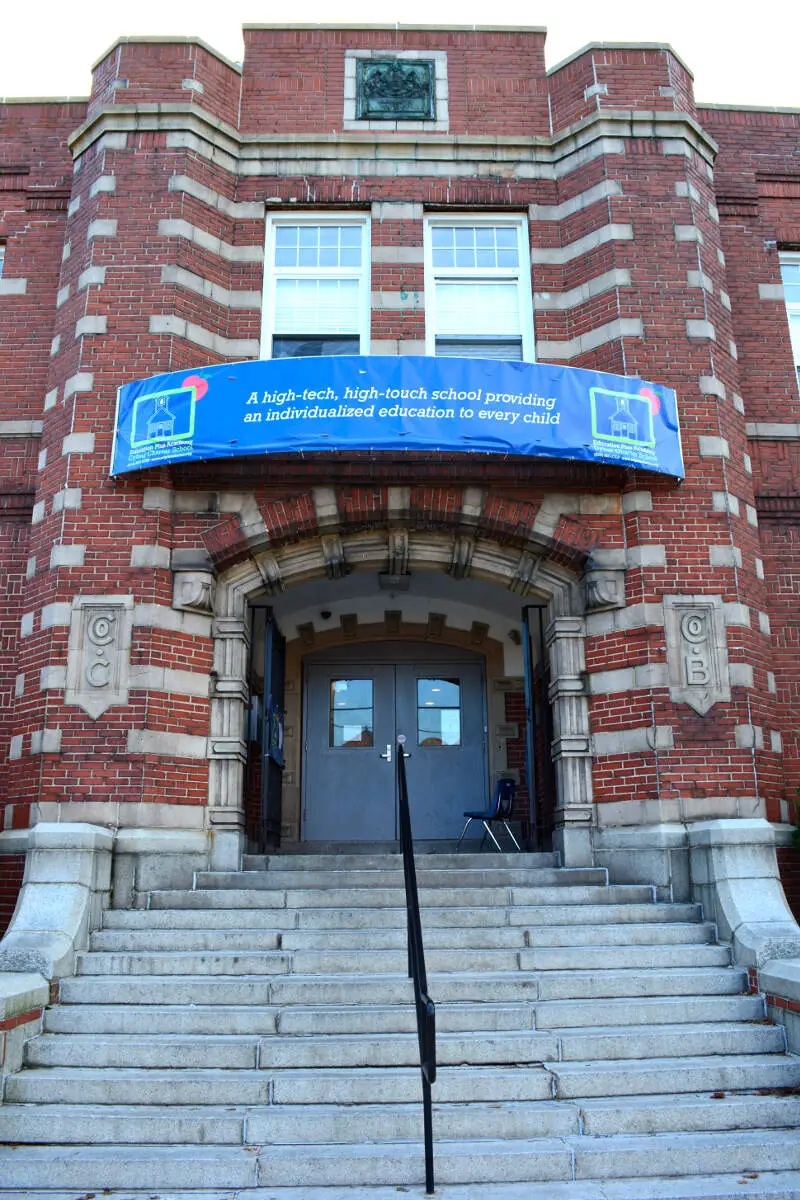
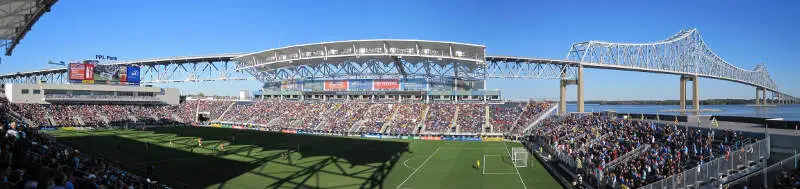
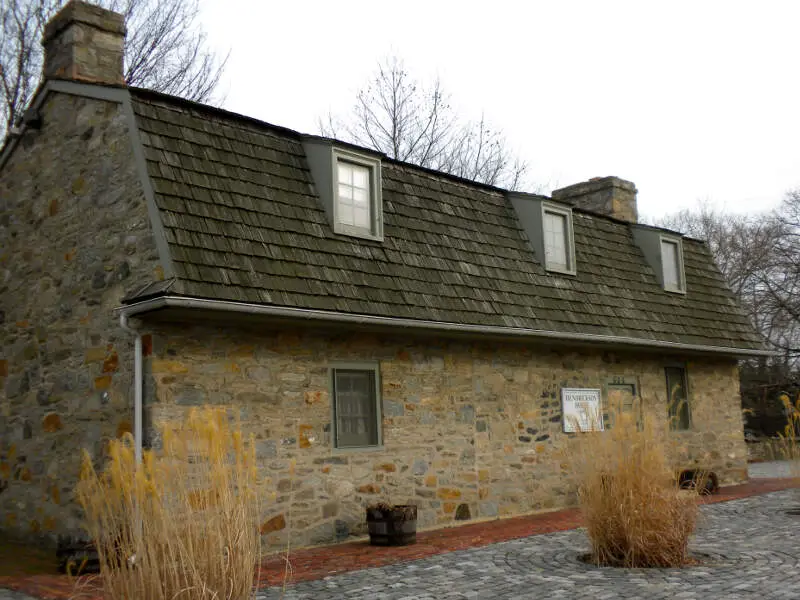
Chester, PA Photos
2 Reviews & Comments About Chester
/5

ChesterWolf The Griffin -
This is outdated Chester Pennsylvania which is where I'm from as you can see in my Avatar name. A new survey conducted in 2017 says Chester is number 17 Min unemployment 6 out of every 10 citizens are jobless. The EPA has actually considered putting Chester on the list of top 10 most polluted cities in the world the air pollution in Chester has reached record highs. Chester is also one of the most politically corrupt cities in America. Chester also has the highest homicide and murder rates pertinent next to Chicago. In 2014 Chester crime rate reached an all-time high there were more than 276 murders during the 2014 and 2015 years the United States National Guard and army actually had to patrol the streets of Chester Pennsylvania for 6 years straight they were literally driving around and military-style vehicles..
Duane Armstrong -
I was born in Chester went to visit November 2016 stayed till April 2017 and went back to Atlanta will never go back to Chester pa ever in my life again
Rankings for Chester in Pennsylvania


Locations Around Chester
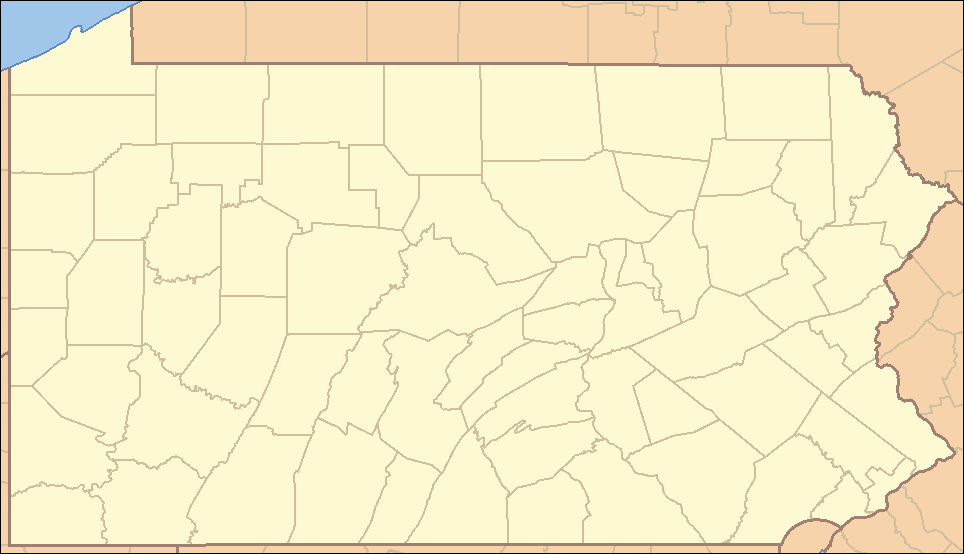
Map Of Chester, PA
Best Places Around Chester
Ashland, NJ
Population 9,383
Penn Wynne, PA
Population 6,127
Wyndmoor, PA
Population 5,698
Ardmore, PA
Population 14,075
Conshohocken, PA
Population 9,182
Paoli, PA
Population 6,121
Swarthmore, PA
Population 6,507
Haddon Heights, NJ
Population 7,484
Audubon, PA
Population 9,141
Folsom, PA
Population 8,535
Chester Demographics And Statistics
Population over time in Chester
The current population in Chester is 33,048. The population has decreased -4.1% from 2010.
| Year | Population | % Change |
|---|---|---|
| 2022 | 33,048 | -2.7% |
| 2021 | 33,977 | -0.4% |
| 2020 | 34,102 | 0.1% |
| 2019 | 34,056 | 0.1% |
| 2018 | 34,016 | 0.0% |
| 2017 | 34,007 | -0.0% |
| 2016 | 34,011 | -0.3% |
| 2015 | 34,127 | -0.6% |
| 2014 | 34,336 | -0.4% |
| 2013 | 34,464 | - |
Race / Ethnicity in Chester
Chester is:
13.2% White with 4,365 White residents.
75.2% African American with 24,847 African American residents.
0.0% American Indian with 9 American Indian residents.
0.6% Asian with 206 Asian residents.
0.0% Hawaiian with 0 Hawaiian residents.
0.6% Other with 208 Other residents.
3.0% Two Or More with 999 Two Or More residents.
7.3% Hispanic with 2,414 Hispanic residents.
| Race | Chester | PA | USA |
|---|---|---|---|
| White | 13.2% | 74.5% | 58.9% |
| African American | 75.2% | 10.4% | 12.1% |
| American Indian | 0.0% | 0.1% | 0.6% |
| Asian | 0.6% | 3.6% | 5.7% |
| Hawaiian | 0.0% | 0.0% | 0.2% |
| Other | 0.6% | 0.4% | 0.4% |
| Two Or More | 3.0% | 3.0% | 3.5% |
| Hispanic | 7.3% | 8.1% | 18.7% |
Gender in Chester
Chester is 51.6% female with 17,068 female residents.
Chester is 48.4% male with 15,979 male residents.
| Gender | Chester | PA | USA |
|---|---|---|---|
| Female | 51.6% | 50.6% | 50.4% |
| Male | 48.4% | 49.4% | 49.6% |
Highest level of educational attainment in Chester for adults over 25
5.0% of adults in Chester completed < 9th grade.
9.0% of adults in Chester completed 9-12th grade.
48.0% of adults in Chester completed high school / ged.
17.0% of adults in Chester completed some college.
8.0% of adults in Chester completed associate's degree.
10.0% of adults in Chester completed bachelor's degree.
3.0% of adults in Chester completed master's degree.
0.0% of adults in Chester completed professional degree.
0.0% of adults in Chester completed doctorate degree.
| Education | Chester | PA | USA |
|---|---|---|---|
| < 9th Grade | 5.0% | 2.0% | 4.0% |
| 9-12th Grade | 9.0% | 5.0% | 6.0% |
| High School / GED | 48.0% | 34.0% | 26.0% |
| Some College | 17.0% | 16.0% | 20.0% |
| Associate's Degree | 8.0% | 9.0% | 9.0% |
| Bachelor's Degree | 10.0% | 20.0% | 21.0% |
| Master's Degree | 3.0% | 10.0% | 10.0% |
| Professional Degree | 0.0% | 2.0% | 2.0% |
| Doctorate Degree | 0.0% | 2.0% | 2.0% |
Household Income For Chester, Pennsylvania
9.2% of households in Chester earn Less than $10,000.
8.4% of households in Chester earn $10,000 to $14,999.
15.6% of households in Chester earn $15,000 to $24,999.
13.0% of households in Chester earn $25,000 to $34,999.
12.6% of households in Chester earn $35,000 to $49,999.
16.0% of households in Chester earn $50,000 to $74,999.
12.2% of households in Chester earn $75,000 to $99,999.
8.8% of households in Chester earn $100,000 to $149,999.
3.1% of households in Chester earn $150,000 to $199,999.
1.1% of households in Chester earn $200,000 or more.
| Income | Chester | PA | USA |
|---|---|---|---|
| Less than $10,000 | 9.2% | 4.8% | 4.9% |
| $10,000 to $14,999 | 8.4% | 3.9% | 3.8% |
| $15,000 to $24,999 | 15.6% | 7.4% | 7.0% |
| $25,000 to $34,999 | 13.0% | 7.6% | 7.4% |
| $35,000 to $49,999 | 12.6% | 11.0% | 10.7% |
| $50,000 to $74,999 | 16.0% | 16.3% | 16.1% |
| $75,000 to $99,999 | 12.2% | 13.0% | 12.8% |
| $100,000 to $149,999 | 8.8% | 17.2% | 17.1% |
| $150,000 to $199,999 | 3.1% | 8.5% | 8.8% |
| $200,000 or more | 1.1% | 10.2% | 11.4% |


