Collegeville, PA
Demographics And Statistics
Living In Collegeville, Pennsylvania Summary
Life in Collegeville research summary. HomeSnacks has been using Saturday Night Science to research the quality of life in Collegeville over the past nine years using Census, FBI, Zillow, and other primary data sources. Based on the most recently available data, we found the following about life in Collegeville:
The population in Collegeville is 5,172.
The median home value in Collegeville is $512,844.
The median income in Collegeville is $99,271.
The median rent in Collegeville is $1,331.
The unemployment rate in Collegeville is 7.2%.
The poverty rate in Collegeville is 5.1%.
The average high in Collegeville is 63.5° and the average low is 43.9°.
Collegeville SnackAbility
Overall SnackAbility
Collegeville, PA Crime Report
Crime in Collegeville summary. We use data from the FBI to determine the crime rates in Collegeville. Key points include:
There were 22 total crimes in Collegeville in the last reporting year.
The overall crime rate per 100,000 people in Collegeville is 430.1 / 100k people.
The violent crime rate per 100,000 people in Collegeville is 19.6 / 100k people.
The property crime rate per 100,000 people in Collegeville is 410.6 / 100k people.
Overall, crime in Collegeville is -81.49% below the national average.
Total Crimes
Below National Average
Crime In Collegeville Comparison Table
| Statistic | Count Raw |
Collegeville / 100k People |
Pennsylvania / 100k People |
National / 100k People |
|---|---|---|---|---|
| Total Crimes Per 100K | 22 | 430.1 | 2,033.6 | 2,324.2 |
| Violent Crime | 1 | 19.6 | 389.5 | 369.8 |
| Murder | 0 | 0.0 | 7.9 | 6.3 |
| Robbery | 0 | 0.0 | 83.9 | 66.1 |
| Aggravated Assault | 1 | 19.6 | 264.6 | 268.2 |
| Property Crime | 21 | 410.6 | 1,644.1 | 1,954.4 |
| Burglary | 1 | 19.6 | 248.6 | 269.8 |
| Larceny | 19 | 371.5 | 1,274.5 | 1,401.9 |
| Car Theft | 0 | 0.0 | 121.0 | 282.7 |
Collegeville, PA Weather
The average high in Collegeville is 63.5° and the average low is 43.9°.
There are 75.1 days of precipitation each year.
Expect an average of 46.9 inches of precipitation each year with 18.7 inches of snow.
| Stat | Collegeville |
|---|---|
| Average Annual High | 63.5 |
| Average Annual Low | 43.9 |
| Annual Precipitation Days | 75.1 |
| Average Annual Precipitation | 46.9 |
| Average Annual Snowfall | 18.7 |
Average High
Days of Rain
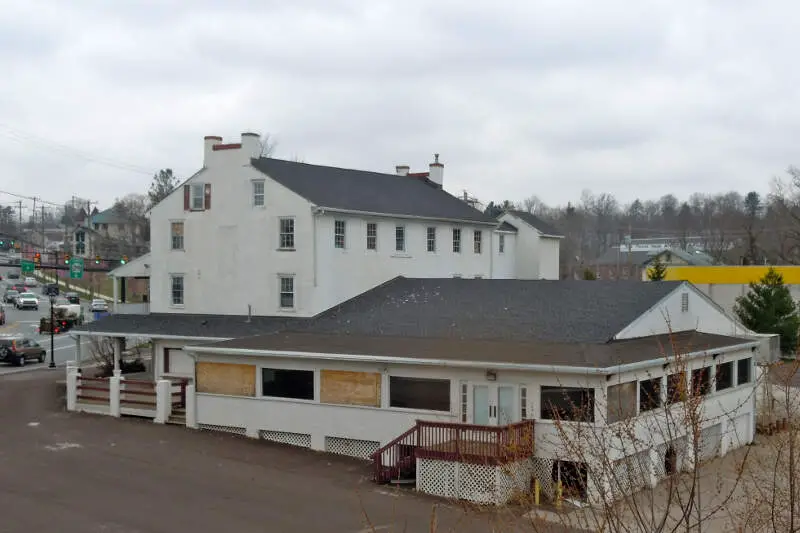
Collegeville, PA Photos
Rankings for Collegeville in Pennsylvania


Locations Around Collegeville
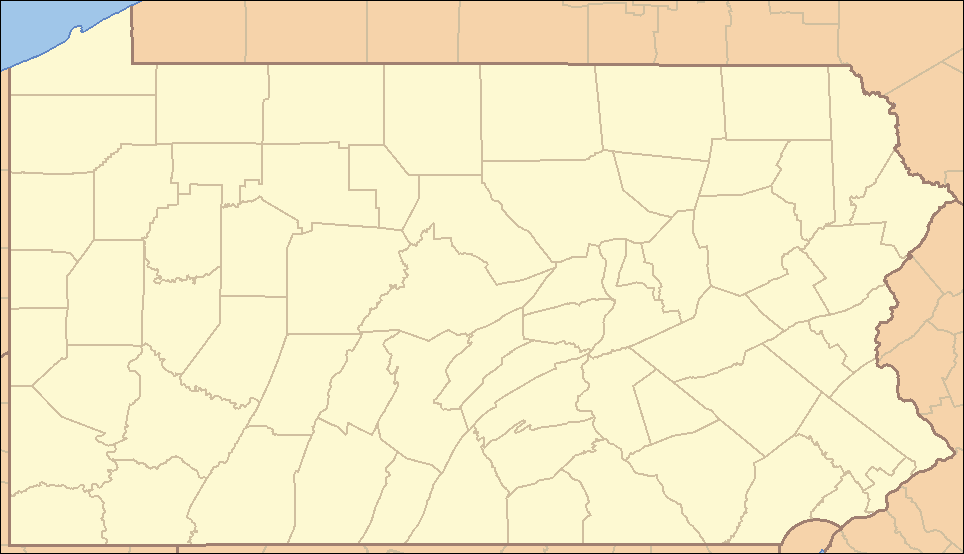
Map Of Collegeville, PA
Best Places Around Collegeville
Penn Wynne, PA
Population 6,127
Oreland, PA
Population 6,123
Glenside, PA
Population 7,726
Wyndmoor, PA
Population 5,698
Montgomeryville, PA
Population 13,008
Maple Glen, PA
Population 6,637
Ardmore, PA
Population 14,075
Trooper, PA
Population 5,185
Blue Bell, PA
Population 6,428
Hatboro, PA
Population 8,176
Collegeville Demographics And Statistics
Population over time in Collegeville
The current population in Collegeville is 5,172. The population has increased 0.4% from 2010.
| Year | Population | % Change |
|---|---|---|
| 2022 | 5,172 | 0.0% |
| 2021 | 5,170 | -1.0% |
| 2020 | 5,221 | -1.1% |
| 2019 | 5,279 | -0.3% |
| 2018 | 5,296 | 0.6% |
| 2017 | 5,263 | 0.8% |
| 2016 | 5,220 | 2.1% |
| 2015 | 5,114 | -0.3% |
| 2014 | 5,129 | -0.4% |
| 2013 | 5,150 | - |
Race / Ethnicity in Collegeville
Collegeville is:
81.6% White with 4,218 White residents.
5.9% African American with 305 African American residents.
0.0% American Indian with 0 American Indian residents.
3.3% Asian with 169 Asian residents.
0.0% Hawaiian with 0 Hawaiian residents.
0.0% Other with 0 Other residents.
5.3% Two Or More with 274 Two Or More residents.
4.0% Hispanic with 206 Hispanic residents.
| Race | Collegeville | PA | USA |
|---|---|---|---|
| White | 81.6% | 74.5% | 58.9% |
| African American | 5.9% | 10.4% | 12.1% |
| American Indian | 0.0% | 0.1% | 0.6% |
| Asian | 3.3% | 3.6% | 5.7% |
| Hawaiian | 0.0% | 0.0% | 0.2% |
| Other | 0.0% | 0.4% | 0.4% |
| Two Or More | 5.3% | 3.0% | 3.5% |
| Hispanic | 4.0% | 8.1% | 18.7% |
Gender in Collegeville
Collegeville is 57.6% female with 2,980 female residents.
Collegeville is 42.4% male with 2,192 male residents.
| Gender | Collegeville | PA | USA |
|---|---|---|---|
| Female | 57.6% | 50.6% | 50.4% |
| Male | 42.4% | 49.4% | 49.6% |
Highest level of educational attainment in Collegeville for adults over 25
-1.0% of adults in Collegeville completed < 9th grade.
1.0% of adults in Collegeville completed 9-12th grade.
22.0% of adults in Collegeville completed high school / ged.
12.0% of adults in Collegeville completed some college.
7.0% of adults in Collegeville completed associate's degree.
40.0% of adults in Collegeville completed bachelor's degree.
14.0% of adults in Collegeville completed master's degree.
1.0% of adults in Collegeville completed professional degree.
4.0% of adults in Collegeville completed doctorate degree.
| Education | Collegeville | PA | USA |
|---|---|---|---|
| < 9th Grade | -1.0% | 2.0% | 4.0% |
| 9-12th Grade | 1.0% | 5.0% | 6.0% |
| High School / GED | 22.0% | 34.0% | 26.0% |
| Some College | 12.0% | 16.0% | 20.0% |
| Associate's Degree | 7.0% | 9.0% | 9.0% |
| Bachelor's Degree | 40.0% | 20.0% | 21.0% |
| Master's Degree | 14.0% | 10.0% | 10.0% |
| Professional Degree | 1.0% | 2.0% | 2.0% |
| Doctorate Degree | 4.0% | 2.0% | 2.0% |
Household Income For Collegeville, Pennsylvania
5.1% of households in Collegeville earn Less than $10,000.
1.2% of households in Collegeville earn $10,000 to $14,999.
2.3% of households in Collegeville earn $15,000 to $24,999.
3.8% of households in Collegeville earn $25,000 to $34,999.
16.4% of households in Collegeville earn $35,000 to $49,999.
10.2% of households in Collegeville earn $50,000 to $74,999.
11.1% of households in Collegeville earn $75,000 to $99,999.
10.2% of households in Collegeville earn $100,000 to $149,999.
14.3% of households in Collegeville earn $150,000 to $199,999.
25.3% of households in Collegeville earn $200,000 or more.
| Income | Collegeville | PA | USA |
|---|---|---|---|
| Less than $10,000 | 5.1% | 4.8% | 4.9% |
| $10,000 to $14,999 | 1.2% | 3.9% | 3.8% |
| $15,000 to $24,999 | 2.3% | 7.4% | 7.0% |
| $25,000 to $34,999 | 3.8% | 7.6% | 7.4% |
| $35,000 to $49,999 | 16.4% | 11.0% | 10.7% |
| $50,000 to $74,999 | 10.2% | 16.3% | 16.1% |
| $75,000 to $99,999 | 11.1% | 13.0% | 12.8% |
| $100,000 to $149,999 | 10.2% | 17.2% | 17.1% |
| $150,000 to $199,999 | 14.3% | 8.5% | 8.8% |
| $200,000 or more | 25.3% | 10.2% | 11.4% |


