New Holland, PA
Demographics And Statistics
Living In New Holland, Pennsylvania Summary
Life in New Holland research summary. HomeSnacks has been using Saturday Night Science to research the quality of life in New Holland over the past nine years using Census, FBI, Zillow, and other primary data sources. Based on the most recently available data, we found the following about life in New Holland:
The population in New Holland is 5,734.
The median home value in New Holland is $358,363.
The median income in New Holland is $59,553.
The cost of living in New Holland is 106 which is 1.1x higher than the national average.
The median rent in New Holland is $1,124.
The unemployment rate in New Holland is 2.6%.
The poverty rate in New Holland is 5.7%.
The average high in New Holland is 62.8° and the average low is 42.9°.
Table Of Contents
New Holland SnackAbility
Overall SnackAbility
New Holland, PA Cost Of Living
Cost of living in New Holland summary. We use data on the cost of living to determine how expensive it is to live in New Holland. Real estate prices drive most of the variance in cost of living around Pennsylvania. Key points include:
The cost of living in New Holland is 106 with 100 being average.
The cost of living in New Holland is 1.1x higher than the national average.
The median home value in New Holland is $358,363.
The median income in New Holland is $59,553.
New Holland's Overall Cost Of Living
Higher Than The National Average
Cost Of Living In New Holland Comparison Table
| Living Expense | New Holland | Pennsylvania | National Average | |
|---|---|---|---|---|
| Overall | 106 | 97 | 100 | |
| Services | 108 | 99 | 100 | |
| Groceries | 101 | 101 | 100 | |
| Health | 137 | 97 | 100 | |
| Housing | 102 | 85 | 100 | |
| Transportation | 113 | 105 | 100 | |
| Utilities | 87 | 106 | 100 | |
New Holland, PA Weather
The average high in New Holland is 62.8° and the average low is 42.9°.
There are 76.7 days of precipitation each year.
Expect an average of 43.7 inches of precipitation each year with 23.2 inches of snow.
| Stat | New Holland |
|---|---|
| Average Annual High | 62.8 |
| Average Annual Low | 42.9 |
| Annual Precipitation Days | 76.7 |
| Average Annual Precipitation | 43.7 |
| Average Annual Snowfall | 23.2 |
Average High
Days of Rain
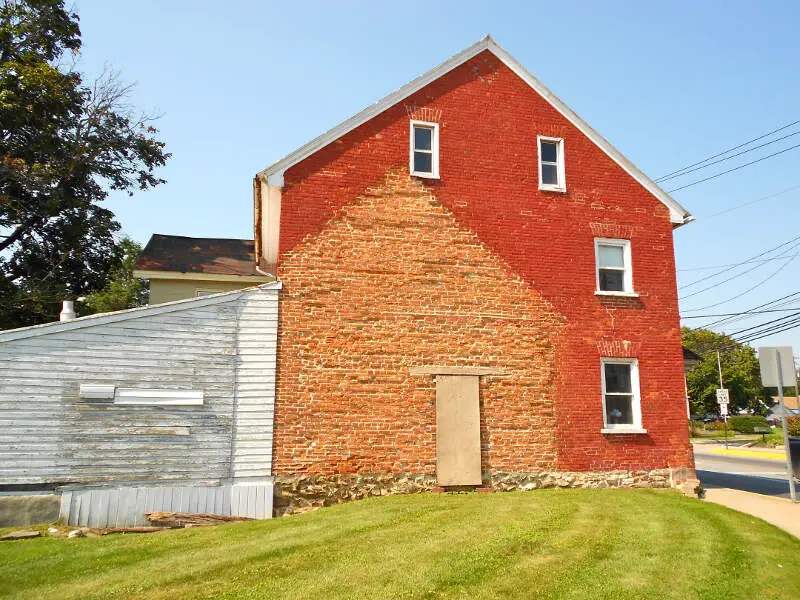
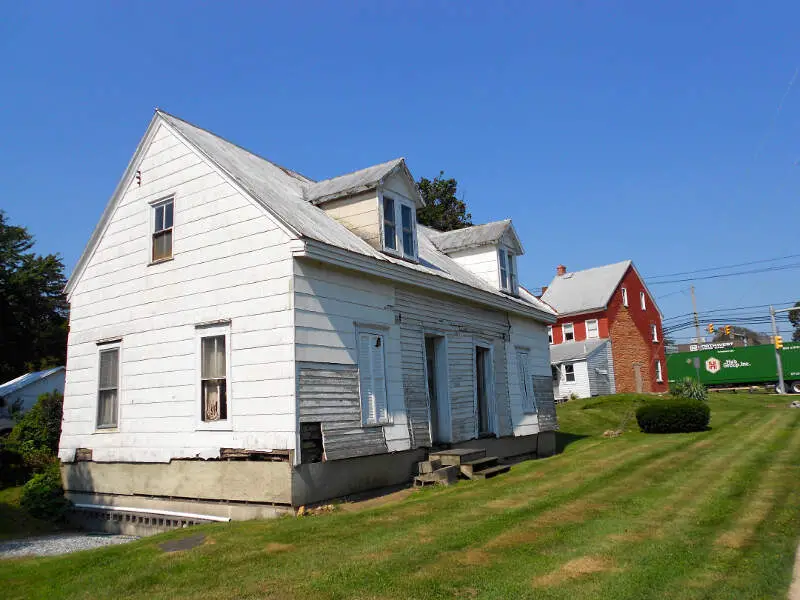
New Holland, PA Photos
Rankings for New Holland in Pennsylvania


Locations Around New Holland
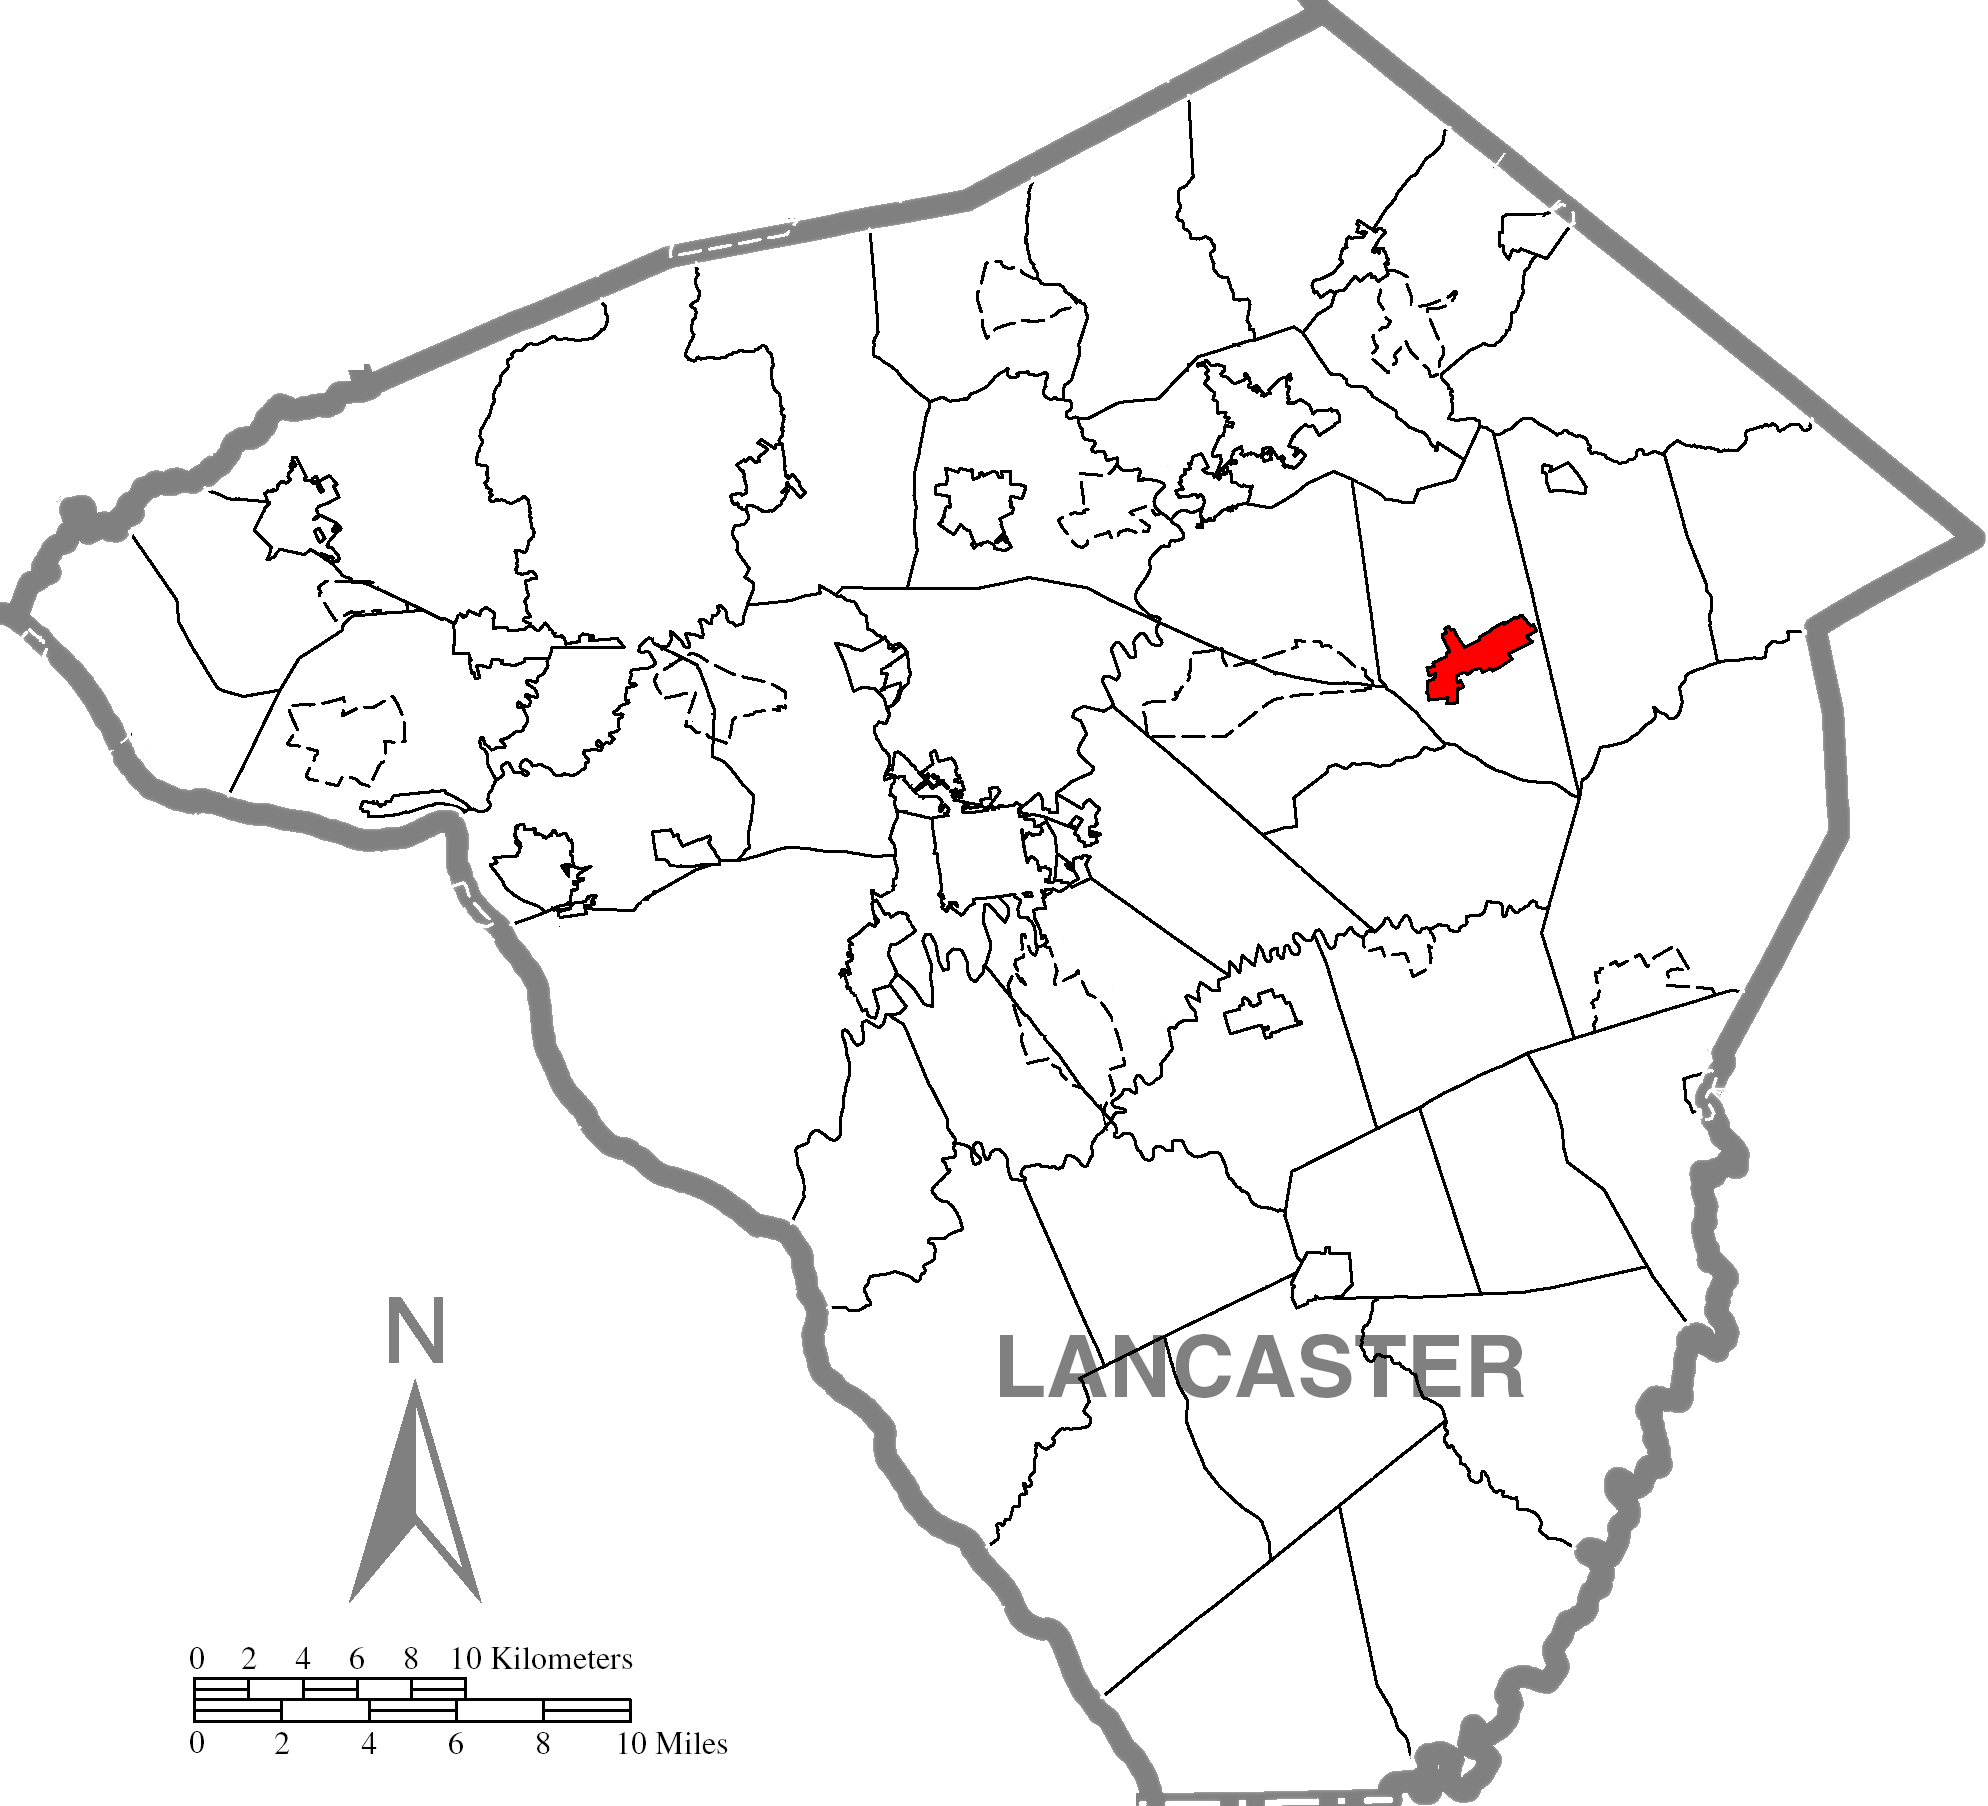
Map Of New Holland, PA
Best Places Around New Holland
Whitfield, PA
Population 5,269
Lititz, PA
Population 9,559
Millersville, PA
Population 8,426
Ephrata, PA
Population 13,738
Willow Street, PA
Population 9,640
Shillington, PA
Population 5,458
Wyomissing, PA
Population 11,067
Birdsboro, PA
Population 5,106
Leola, PA
Population 7,945
Coatesville, PA
Population 13,316
New Holland Demographics And Statistics
Population over time in New Holland
The current population in New Holland is 5,734. The population has increased 7.3% from 2010.
| Year | Population | % Change |
|---|---|---|
| 2022 | 5,734 | 5.1% |
| 2021 | 5,455 | 0.2% |
| 2020 | 5,445 | 0.5% |
| 2019 | 5,418 | 0.2% |
| 2018 | 5,408 | 0.0% |
| 2017 | 5,407 | 0.1% |
| 2016 | 5,400 | 0.3% |
| 2015 | 5,384 | 0.2% |
| 2014 | 5,373 | 0.6% |
| 2013 | 5,343 | - |
Race / Ethnicity in New Holland
New Holland is:
73.0% White with 4,185 White residents.
3.5% African American with 203 African American residents.
0.0% American Indian with 0 American Indian residents.
4.6% Asian with 261 Asian residents.
0.0% Hawaiian with 0 Hawaiian residents.
1.1% Other with 64 Other residents.
4.9% Two Or More with 282 Two Or More residents.
12.9% Hispanic with 739 Hispanic residents.
| Race | New Holland | PA | USA |
|---|---|---|---|
| White | 73.0% | 74.5% | 58.9% |
| African American | 3.5% | 10.4% | 12.1% |
| American Indian | 0.0% | 0.1% | 0.6% |
| Asian | 4.6% | 3.6% | 5.7% |
| Hawaiian | 0.0% | 0.0% | 0.2% |
| Other | 1.1% | 0.4% | 0.4% |
| Two Or More | 4.9% | 3.0% | 3.5% |
| Hispanic | 12.9% | 8.1% | 18.7% |
Gender in New Holland
New Holland is 47.1% female with 2,702 female residents.
New Holland is 52.9% male with 3,031 male residents.
| Gender | New Holland | PA | USA |
|---|---|---|---|
| Female | 47.1% | 50.6% | 50.4% |
| Male | 52.9% | 49.4% | 49.6% |
Highest level of educational attainment in New Holland for adults over 25
5.0% of adults in New Holland completed < 9th grade.
7.0% of adults in New Holland completed 9-12th grade.
37.0% of adults in New Holland completed high school / ged.
19.0% of adults in New Holland completed some college.
9.0% of adults in New Holland completed associate's degree.
17.0% of adults in New Holland completed bachelor's degree.
6.0% of adults in New Holland completed master's degree.
0.0% of adults in New Holland completed professional degree.
0.0% of adults in New Holland completed doctorate degree.
| Education | New Holland | PA | USA |
|---|---|---|---|
| < 9th Grade | 5.0% | 2.0% | 4.0% |
| 9-12th Grade | 7.0% | 5.0% | 6.0% |
| High School / GED | 37.0% | 34.0% | 26.0% |
| Some College | 19.0% | 16.0% | 20.0% |
| Associate's Degree | 9.0% | 9.0% | 9.0% |
| Bachelor's Degree | 17.0% | 20.0% | 21.0% |
| Master's Degree | 6.0% | 10.0% | 10.0% |
| Professional Degree | 0.0% | 2.0% | 2.0% |
| Doctorate Degree | 0.0% | 2.0% | 2.0% |
Household Income For New Holland, Pennsylvania
6.7% of households in New Holland earn Less than $10,000.
1.2% of households in New Holland earn $10,000 to $14,999.
11.0% of households in New Holland earn $15,000 to $24,999.
7.6% of households in New Holland earn $25,000 to $34,999.
13.8% of households in New Holland earn $35,000 to $49,999.
18.5% of households in New Holland earn $50,000 to $74,999.
14.8% of households in New Holland earn $75,000 to $99,999.
12.0% of households in New Holland earn $100,000 to $149,999.
6.7% of households in New Holland earn $150,000 to $199,999.
7.8% of households in New Holland earn $200,000 or more.
| Income | New Holland | PA | USA |
|---|---|---|---|
| Less than $10,000 | 6.7% | 4.8% | 4.9% |
| $10,000 to $14,999 | 1.2% | 3.9% | 3.8% |
| $15,000 to $24,999 | 11.0% | 7.4% | 7.0% |
| $25,000 to $34,999 | 7.6% | 7.6% | 7.4% |
| $35,000 to $49,999 | 13.8% | 11.0% | 10.7% |
| $50,000 to $74,999 | 18.5% | 16.3% | 16.1% |
| $75,000 to $99,999 | 14.8% | 13.0% | 12.8% |
| $100,000 to $149,999 | 12.0% | 17.2% | 17.1% |
| $150,000 to $199,999 | 6.7% | 8.5% | 8.8% |
| $200,000 or more | 7.8% | 10.2% | 11.4% |


