Phoenixville, PA
Demographics And Statistics
Living In Phoenixville, Pennsylvania Summary
Life in Phoenixville research summary. HomeSnacks has been using Saturday Night Science to research the quality of life in Phoenixville over the past nine years using Census, FBI, Zillow, and other primary data sources. Based on the most recently available data, we found the following about life in Phoenixville:
The population in Phoenixville is 18,723.
The median home value in Phoenixville is $466,022.
The median income in Phoenixville is $91,593.
The cost of living in Phoenixville is 111 which is 1.1x higher than the national average.
The median rent in Phoenixville is $1,501.
The unemployment rate in Phoenixville is 3.5%.
The poverty rate in Phoenixville is 10.1%.
The average high in Phoenixville is 63.8° and the average low is 42.9°.
Table Of Contents
Phoenixville SnackAbility
Overall SnackAbility
Phoenixville, PA Cost Of Living
Cost of living in Phoenixville summary. We use data on the cost of living to determine how expensive it is to live in Phoenixville. Real estate prices drive most of the variance in cost of living around Pennsylvania. Key points include:
The cost of living in Phoenixville is 111 with 100 being average.
The cost of living in Phoenixville is 1.1x higher than the national average.
The median home value in Phoenixville is $466,022.
The median income in Phoenixville is $91,593.
Phoenixville's Overall Cost Of Living
Higher Than The National Average
Cost Of Living In Phoenixville Comparison Table
| Living Expense | Phoenixville | Pennsylvania | National Average | |
|---|---|---|---|---|
| Overall | 111 | 97 | 100 | |
| Services | 101 | 99 | 100 | |
| Groceries | 115 | 101 | 100 | |
| Health | 97 | 97 | 100 | |
| Housing | 116 | 85 | 100 | |
| Transportation | 108 | 105 | 100 | |
| Utilities | 113 | 106 | 100 | |
Phoenixville, PA Weather
The average high in Phoenixville is 63.8° and the average low is 42.9°.
There are 76.7 days of precipitation each year.
Expect an average of 45.7 inches of precipitation each year with 20.7 inches of snow.
| Stat | Phoenixville |
|---|---|
| Average Annual High | 63.8 |
| Average Annual Low | 42.9 |
| Annual Precipitation Days | 76.7 |
| Average Annual Precipitation | 45.7 |
| Average Annual Snowfall | 20.7 |
Average High
Days of Rain
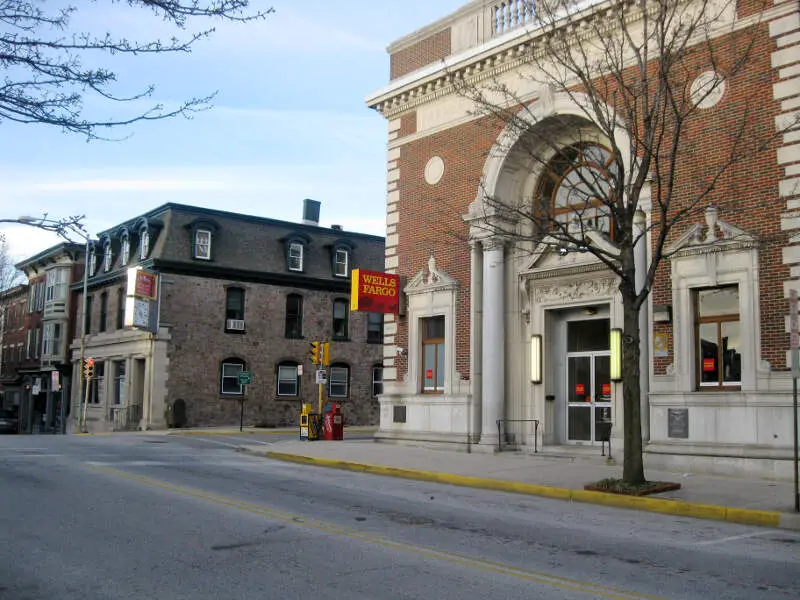
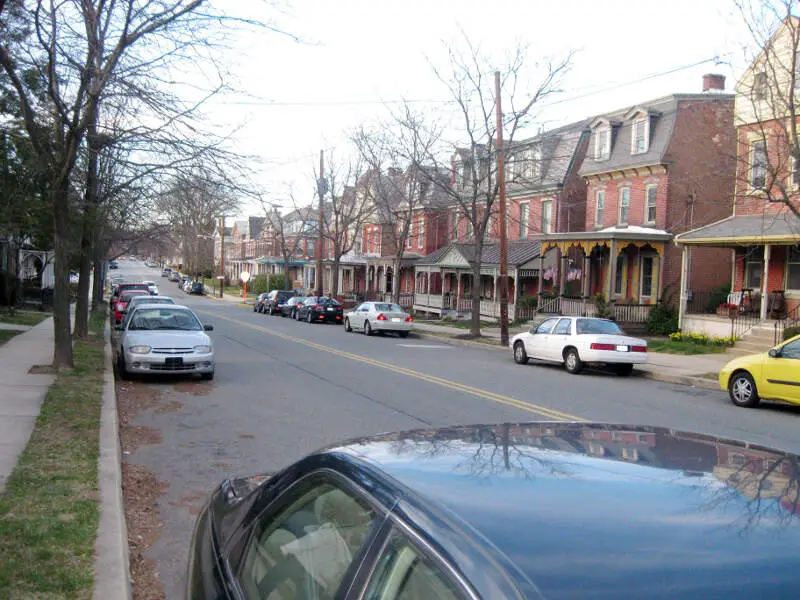
Phoenixville, PA Photos


Rankings for Phoenixville in Pennsylvania


Locations Around Phoenixville
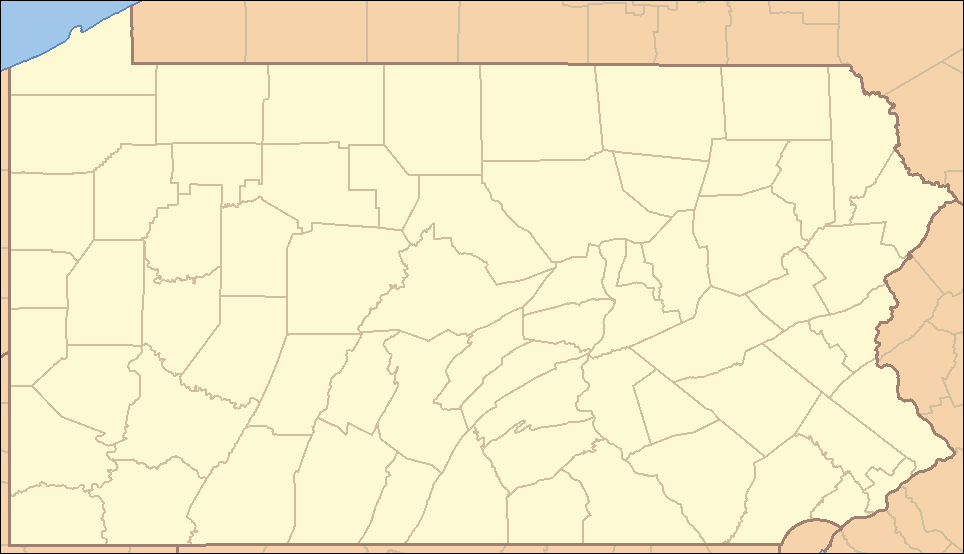
Map Of Phoenixville, PA
Best Places Around Phoenixville
Penn Wynne, PA
Population 6,127
Oreland, PA
Population 6,123
Glenside, PA
Population 7,726
Wyndmoor, PA
Population 5,698
Montgomeryville, PA
Population 13,008
Maple Glen, PA
Population 6,637
Ardmore, PA
Population 14,075
Trooper, PA
Population 5,185
Collegeville, PA
Population 5,172
Blue Bell, PA
Population 6,428
Phoenixville Demographics And Statistics
Population over time in Phoenixville
The current population in Phoenixville is 18,723. The population has increased 15.2% from 2010.
| Year | Population | % Change |
|---|---|---|
| 2022 | 18,723 | 11.3% |
| 2021 | 16,815 | 0.4% |
| 2020 | 16,743 | 0.6% |
| 2019 | 16,638 | 0.5% |
| 2018 | 16,562 | 0.2% |
| 2017 | 16,530 | 0.3% |
| 2016 | 16,480 | 0.3% |
| 2015 | 16,430 | 0.3% |
| 2014 | 16,382 | 0.8% |
| 2013 | 16,249 | - |
Race / Ethnicity in Phoenixville
Phoenixville is:
82.2% White with 15,388 White residents.
4.8% African American with 902 African American residents.
0.0% American Indian with 7 American Indian residents.
4.3% Asian with 798 Asian residents.
0.0% Hawaiian with 0 Hawaiian residents.
0.1% Other with 28 Other residents.
4.4% Two Or More with 833 Two Or More residents.
4.1% Hispanic with 767 Hispanic residents.
| Race | Phoenixville | PA | USA |
|---|---|---|---|
| White | 82.2% | 74.5% | 58.9% |
| African American | 4.8% | 10.4% | 12.1% |
| American Indian | 0.0% | 0.1% | 0.6% |
| Asian | 4.3% | 3.6% | 5.7% |
| Hawaiian | 0.0% | 0.0% | 0.2% |
| Other | 0.1% | 0.4% | 0.4% |
| Two Or More | 4.4% | 3.0% | 3.5% |
| Hispanic | 4.1% | 8.1% | 18.7% |
Gender in Phoenixville
Phoenixville is 45.9% female with 8,600 female residents.
Phoenixville is 54.1% male with 10,122 male residents.
| Gender | Phoenixville | PA | USA |
|---|---|---|---|
| Female | 45.9% | 50.6% | 50.4% |
| Male | 54.1% | 49.4% | 49.6% |
Highest level of educational attainment in Phoenixville for adults over 25
-1.0% of adults in Phoenixville completed < 9th grade.
5.0% of adults in Phoenixville completed 9-12th grade.
24.0% of adults in Phoenixville completed high school / ged.
14.0% of adults in Phoenixville completed some college.
6.0% of adults in Phoenixville completed associate's degree.
34.0% of adults in Phoenixville completed bachelor's degree.
15.0% of adults in Phoenixville completed master's degree.
1.0% of adults in Phoenixville completed professional degree.
2.0% of adults in Phoenixville completed doctorate degree.
| Education | Phoenixville | PA | USA |
|---|---|---|---|
| < 9th Grade | -1.0% | 2.0% | 4.0% |
| 9-12th Grade | 5.0% | 5.0% | 6.0% |
| High School / GED | 24.0% | 34.0% | 26.0% |
| Some College | 14.0% | 16.0% | 20.0% |
| Associate's Degree | 6.0% | 9.0% | 9.0% |
| Bachelor's Degree | 34.0% | 20.0% | 21.0% |
| Master's Degree | 15.0% | 10.0% | 10.0% |
| Professional Degree | 1.0% | 2.0% | 2.0% |
| Doctorate Degree | 2.0% | 2.0% | 2.0% |
Household Income For Phoenixville, Pennsylvania
4.0% of households in Phoenixville earn Less than $10,000.
2.4% of households in Phoenixville earn $10,000 to $14,999.
4.6% of households in Phoenixville earn $15,000 to $24,999.
4.3% of households in Phoenixville earn $25,000 to $34,999.
9.7% of households in Phoenixville earn $35,000 to $49,999.
11.9% of households in Phoenixville earn $50,000 to $74,999.
17.9% of households in Phoenixville earn $75,000 to $99,999.
19.9% of households in Phoenixville earn $100,000 to $149,999.
11.8% of households in Phoenixville earn $150,000 to $199,999.
13.5% of households in Phoenixville earn $200,000 or more.
| Income | Phoenixville | PA | USA |
|---|---|---|---|
| Less than $10,000 | 4.0% | 4.8% | 4.9% |
| $10,000 to $14,999 | 2.4% | 3.9% | 3.8% |
| $15,000 to $24,999 | 4.6% | 7.4% | 7.0% |
| $25,000 to $34,999 | 4.3% | 7.6% | 7.4% |
| $35,000 to $49,999 | 9.7% | 11.0% | 10.7% |
| $50,000 to $74,999 | 11.9% | 16.3% | 16.1% |
| $75,000 to $99,999 | 17.9% | 13.0% | 12.8% |
| $100,000 to $149,999 | 19.9% | 17.2% | 17.1% |
| $150,000 to $199,999 | 11.8% | 8.5% | 8.8% |
| $200,000 or more | 13.5% | 10.2% | 11.4% |


