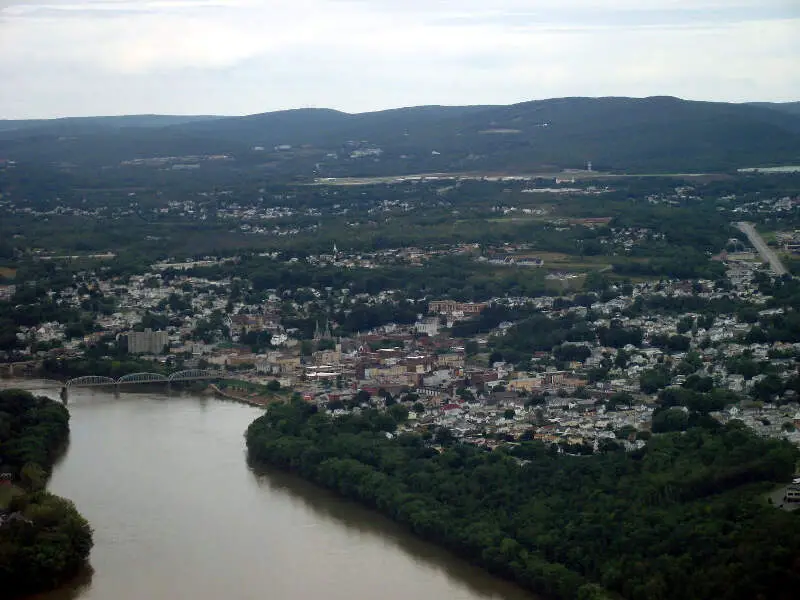
Pittston, PA
Demographics And Statistics
Living In Pittston, Pennsylvania Summary
Life in Pittston research summary. HomeSnacks has been using Saturday Night Science to research the quality of life in Pittston over the past nine years using Census, FBI, Zillow, and other primary data sources. Based on the most recently available data, we found the following about life in Pittston:
The population in Pittston is 7,601.
The median home value in Pittston is $176,112.
The median income in Pittston is $44,863.
The cost of living in Pittston is 87 which is 0.9x lower than the national average.
The median rent in Pittston is $758.
The unemployment rate in Pittston is 6.8%.
The poverty rate in Pittston is 27.7%.
The average high in Pittston is 59.6° and the average low is 40.1°.
Table Of Contents
Pittston SnackAbility
Overall SnackAbility
Pittston, PA Cost Of Living
Cost of living in Pittston summary. We use data on the cost of living to determine how expensive it is to live in Pittston. Real estate prices drive most of the variance in cost of living around Pennsylvania. Key points include:
The cost of living in Pittston is 87 with 100 being average.
The cost of living in Pittston is 0.9x lower than the national average.
The median home value in Pittston is $176,112.
The median income in Pittston is $44,863.
Pittston's Overall Cost Of Living
Lower Than The National Average
Cost Of Living In Pittston Comparison Table
| Living Expense | Pittston | Pennsylvania | National Average | |
|---|---|---|---|---|
| Overall | 87 | 97 | 100 | |
| Services | 96 | 99 | 100 | |
| Groceries | 105 | 101 | 100 | |
| Health | 99 | 97 | 100 | |
| Housing | 56 | 85 | 100 | |
| Transportation | 109 | 105 | 100 | |
| Utilities | 105 | 106 | 100 | |
Pittston, PA Weather
The average high in Pittston is 59.6° and the average low is 40.1°.
There are 78.0 days of precipitation each year.
Expect an average of 38.6 inches of precipitation each year with 43.9 inches of snow.
| Stat | Pittston |
|---|---|
| Average Annual High | 59.6 |
| Average Annual Low | 40.1 |
| Annual Precipitation Days | 78.0 |
| Average Annual Precipitation | 38.6 |
| Average Annual Snowfall | 43.9 |
Average High
Days of Rain
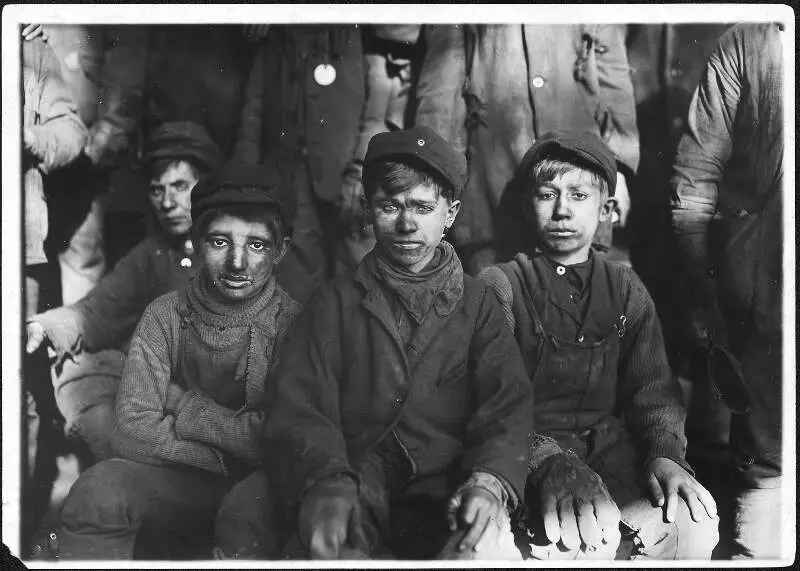
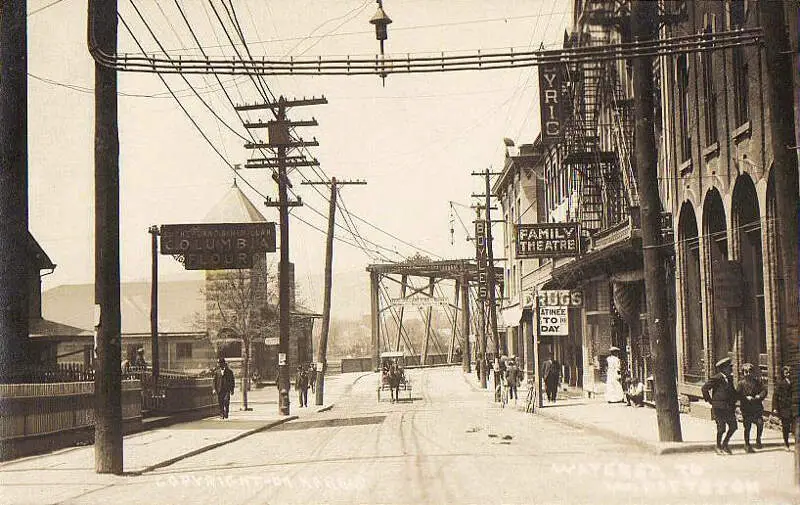
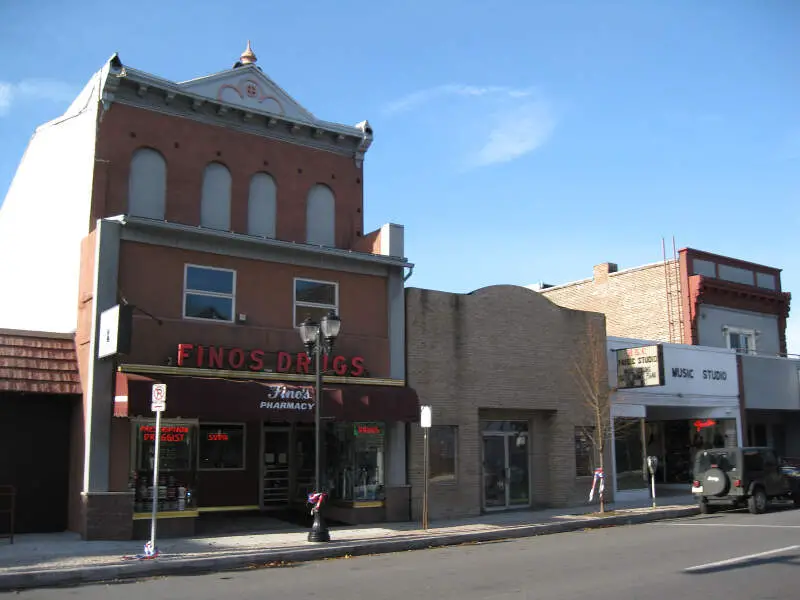
Pittston, PA Photos
1 Reviews & Comments About Pittston
/5

tksavagetactix -
i live in pittston not very red neck its actually the art capital of Pennsylvania alot of classy restaurants alot of murals and almost no one i know of fishes the Susquehanna
Rankings for Pittston in Pennsylvania


Locations Around Pittston
Map Of Pittston, PA
Best Places Around Pittston
Clarks Summit, PA
Population 5,091
Mountain Top, PA
Population 11,791
Old Forge, PA
Population 8,506
Kingston, PA
Population 13,317
Blakely, PA
Population 6,646
Olyphant, PA
Population 5,372
Dunmore, PA
Population 14,082
Dickson, TN
Population 16,051
Swoyersville, PA
Population 5,021
Taylor, PA
Population 6,274
Pittston Demographics And Statistics
Population over time in Pittston
The current population in Pittston is 7,601. The population has decreased -2.2% from 2010.
| Year | Population | % Change |
|---|---|---|
| 2022 | 7,601 | -1.2% |
| 2021 | 7,697 | 0.2% |
| 2020 | 7,682 | 0.2% |
| 2019 | 7,668 | -0.4% |
| 2018 | 7,698 | -0.1% |
| 2017 | 7,702 | -0.1% |
| 2016 | 7,713 | -0.3% |
| 2015 | 7,740 | -0.2% |
| 2014 | 7,757 | -0.2% |
| 2013 | 7,774 | - |
Race / Ethnicity in Pittston
Pittston is:
84.2% White with 6,403 White residents.
5.2% African American with 397 African American residents.
0.0% American Indian with 1 American Indian residents.
0.9% Asian with 68 Asian residents.
0.0% Hawaiian with 0 Hawaiian residents.
0.2% Other with 14 Other residents.
3.2% Two Or More with 240 Two Or More residents.
6.3% Hispanic with 478 Hispanic residents.
| Race | Pittston | PA | USA |
|---|---|---|---|
| White | 84.2% | 74.5% | 58.9% |
| African American | 5.2% | 10.4% | 12.1% |
| American Indian | 0.0% | 0.1% | 0.6% |
| Asian | 0.9% | 3.6% | 5.7% |
| Hawaiian | 0.0% | 0.0% | 0.2% |
| Other | 0.2% | 0.4% | 0.4% |
| Two Or More | 3.2% | 3.0% | 3.5% |
| Hispanic | 6.3% | 8.1% | 18.7% |
Gender in Pittston
Pittston is 55.5% female with 4,222 female residents.
Pittston is 44.5% male with 3,378 male residents.
| Gender | Pittston | PA | USA |
|---|---|---|---|
| Female | 55.5% | 50.6% | 50.4% |
| Male | 44.5% | 49.4% | 49.6% |
Highest level of educational attainment in Pittston for adults over 25
2.0% of adults in Pittston completed < 9th grade.
6.0% of adults in Pittston completed 9-12th grade.
40.0% of adults in Pittston completed high school / ged.
21.0% of adults in Pittston completed some college.
11.0% of adults in Pittston completed associate's degree.
12.0% of adults in Pittston completed bachelor's degree.
6.0% of adults in Pittston completed master's degree.
1.0% of adults in Pittston completed professional degree.
1.0% of adults in Pittston completed doctorate degree.
| Education | Pittston | PA | USA |
|---|---|---|---|
| < 9th Grade | 2.0% | 2.0% | 4.0% |
| 9-12th Grade | 6.0% | 5.0% | 6.0% |
| High School / GED | 40.0% | 34.0% | 26.0% |
| Some College | 21.0% | 16.0% | 20.0% |
| Associate's Degree | 11.0% | 9.0% | 9.0% |
| Bachelor's Degree | 12.0% | 20.0% | 21.0% |
| Master's Degree | 6.0% | 10.0% | 10.0% |
| Professional Degree | 1.0% | 2.0% | 2.0% |
| Doctorate Degree | 1.0% | 2.0% | 2.0% |
Household Income For Pittston, Pennsylvania
7.8% of households in Pittston earn Less than $10,000.
6.8% of households in Pittston earn $10,000 to $14,999.
12.6% of households in Pittston earn $15,000 to $24,999.
15.1% of households in Pittston earn $25,000 to $34,999.
14.4% of households in Pittston earn $35,000 to $49,999.
13.5% of households in Pittston earn $50,000 to $74,999.
10.2% of households in Pittston earn $75,000 to $99,999.
13.3% of households in Pittston earn $100,000 to $149,999.
3.7% of households in Pittston earn $150,000 to $199,999.
2.6% of households in Pittston earn $200,000 or more.
| Income | Pittston | PA | USA |
|---|---|---|---|
| Less than $10,000 | 7.8% | 4.8% | 4.9% |
| $10,000 to $14,999 | 6.8% | 3.9% | 3.8% |
| $15,000 to $24,999 | 12.6% | 7.4% | 7.0% |
| $25,000 to $34,999 | 15.1% | 7.6% | 7.4% |
| $35,000 to $49,999 | 14.4% | 11.0% | 10.7% |
| $50,000 to $74,999 | 13.5% | 16.3% | 16.1% |
| $75,000 to $99,999 | 10.2% | 13.0% | 12.8% |
| $100,000 to $149,999 | 13.3% | 17.2% | 17.1% |
| $150,000 to $199,999 | 3.7% | 8.5% | 8.8% |
| $200,000 or more | 2.6% | 10.2% | 11.4% |


