100 Biggest Cities In New Jersey For 2023
Using the latest Census data, we detail the 100 biggest cities in New Jersey. You can all see a comprehensive list of all 461 cities and places in New Jersey.

We all love the biggest cities that the Garden State has to offer. You know the places like Newark and Jersey City which make all the headlines.
But there are a bunch of other great large cities in New Jersey that don't get as much love.
We're going to change that right now.
Using the most recent Census data, we can tell you about all the places in New Jersey with a focus on the biggest. We update the data each year and this is our fourth time doing this.
Table Of Contents: Top Ten | Methodology | Table
The Largest Cities In New Jersey For 2023:
You can click here to see a full table of the full of the 100 biggest cities in New Jersey, along with every other place over 1,000 people big. It is sortable by clicking on the headers.
Read on below to see more on the biggest cities. Or for more reading on places to live in New Jersey, check out:
- Best Places To Live In New Jersey
- Cheapest Places To Live In New Jersey
- Most Dangerous Cities In New Jersey
The 10 Biggest Cities In New Jersey
/10
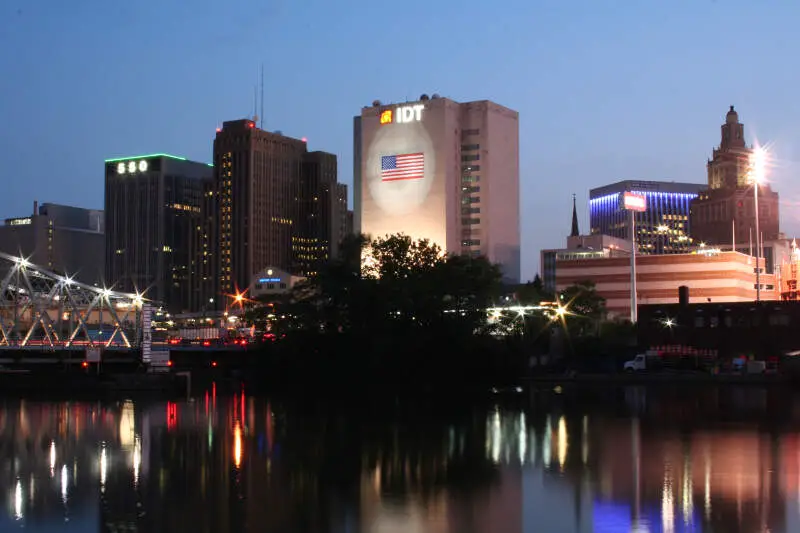
Rank Last Year: 1 (No Change)
Population: 306,247
Population 2010: 274,674
Growth: 11.5%
More on Newark: Data | Crime | Cost Of Living | Real Estate
/10
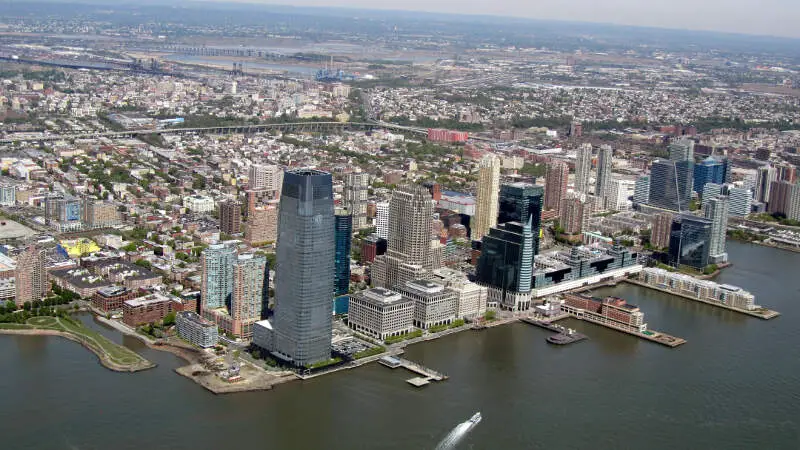
Rank Last Year: 2 (No Change)
Population: 287,146
Population 2010: 243,257
Growth: 18.0%
More on Jersey City: Data | Crime | Cost Of Living | Real Estate
/10
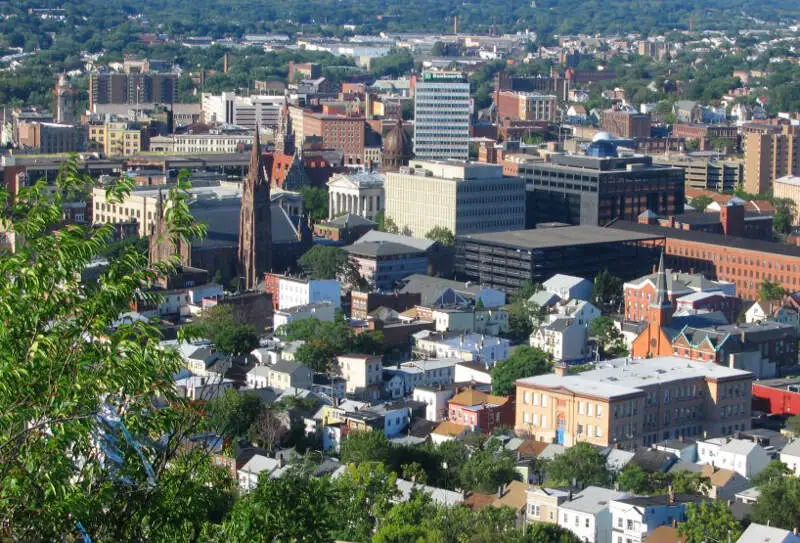
Rank Last Year: 3 (No Change)
Population: 157,927
Population 2010: 145,836
Growth: 8.3%
More on Paterson: Data | Crime | Cost Of Living | Real Estate
/10
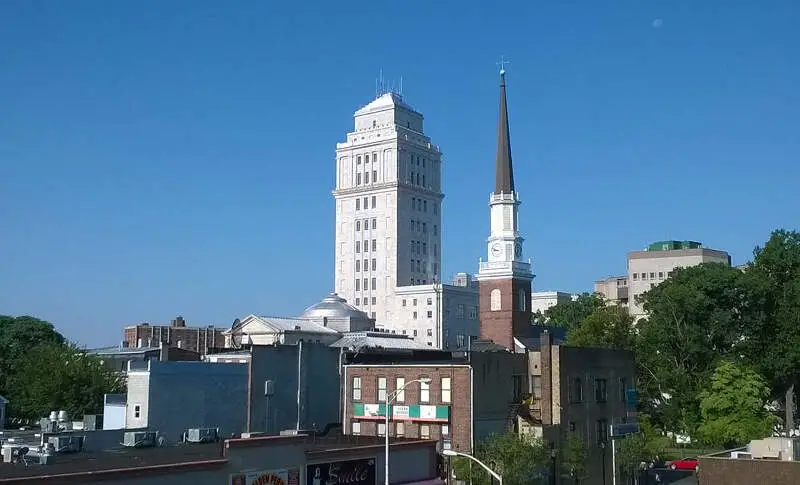
Rank Last Year: 4 (No Change)
Population: 135,772
Population 2010: 123,176
Growth: 10.2%
More on Elizabeth: Data | Crime | Cost Of Living | Real Estate
/10
Rank Last Year: 5 (No Change)
Population: 91,798
Population 2010: 88,841
Growth: 3.3%
More on Toms River: Data | Crime | Cost Of Living | Real Estate
/10
Rank Last Year: 7 (Up 1)
Population: 90,097
Population 2010: 85,181
Growth: 5.8%
More on Trenton: Data | Crime | Cost Of Living | Real Estate
/10
Rank Last Year: 6 (Down 1)
Population: 89,460
Population 2010: 82,776
Growth: 8.1%
More on Clifton: Data | Crime | Cost Of Living | Real Estate
/10
Rank Last Year: 8 (No Change)
Population: 72,381
Population 2010: 78,047
Growth: -7.3%
More on Camden: Data | Cost Of Living | Real Estate
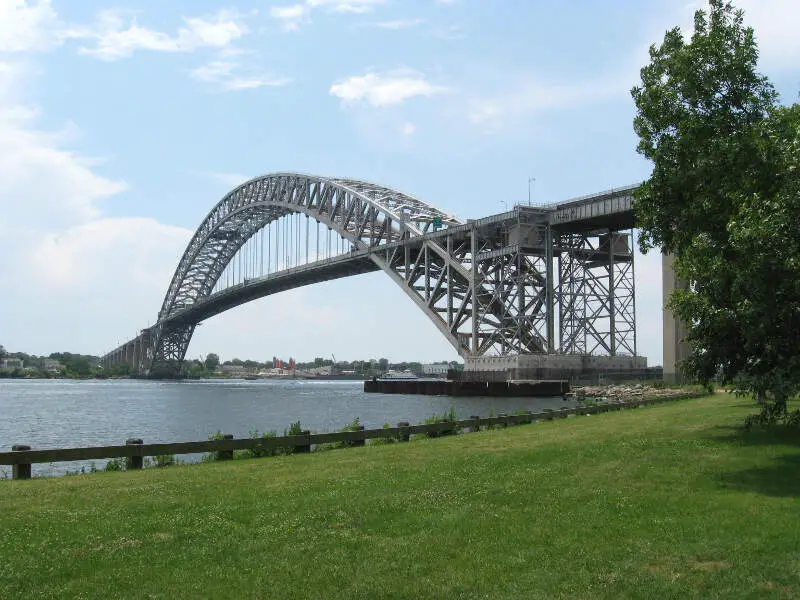
9. Bayonne
/10
Rank Last Year: 11 (Up 2)
Population: 70,553
Population 2010: 62,027
Growth: 13.7%
More on Bayonne: Real Estate
/10
Rank Last Year: 9 (Down 1)
Population: 70,308
Population 2010: 68,982
Growth: 1.9%
More on Passaic: Data | Crime | Cost Of Living | Real Estate
How We Determined The Largest Cities In New Jersey
We've been ranking and dissecting cities in the Garden State for over 4 years now -- making this actually the fourth time we've run the numbers. We always use the best data, the US Census. In this case, that means we are using the American Community Survey.
It what is probably the most simple analysis we run each year, we ranked every place in New Jersey from biggest to smallest. The biggest city this year? That would be Newark.
The smallest? Ship Bottom, although there are places smaller than 1,000 people not listed here, so keep that in mind as we take a look at the top ten.
Now on to numbers 11-100 Biggest in New Jersey
We hope that you find the big city, or really any city, that's right for you. Below is a list of the rest of the biggest cities along with every other place in New Jersey.
Have fun snacking around in the Garden State!
For more reading on New Jersey, check out:
- Best Places To Raise A Family In New Jersey
- Best Places To Retire In New Jersey
- Richest Cities In New Jersey
- Safest Places In New Jersey
- Worst Places To Live In New Jersey
- Most Expensive Places To Live In New Jersey
Detailed List Of The Biggest Cities In New Jersey
| Rank | City | Current Population | 2010 | Growth | |||||
|---|---|---|---|---|---|---|---|---|---|
| 1 | Newark | 306,247 | 274,674 | 11.5% | |||||
| 2 | Jersey City | 287,146 | 243,257 | 18.0% | |||||
| 3 | Paterson | 157,927 | 145,836 | 8.3% | |||||
| 4 | Elizabeth | 135,772 | 123,176 | 10.2% | |||||
| 5 | Toms River | 91,798 | 88,841 | 3.3% | |||||
| 6 | Trenton | 90,097 | 85,181 | 5.8% | |||||
| 7 | Clifton | 89,460 | 82,776 | 8.1% | |||||
| 8 | Camden | 72,381 | 78,047 | -7.3% | |||||
| 9 | Bayonne | 70,553 | 62,027 | 13.7% | |||||
| 10 | Passaic | 70,308 | 68,982 | 1.9% | |||||
| 11 | East Orange | 68,918 | 64,927 | 6.1% | |||||
| 12 | Union City | 67,903 | 65,766 | 3.2% | |||||
| 13 | Lakewood | 66,752 | 49,805 | 34.0% | |||||
| 14 | Vineland | 61,442 | 59,908 | 2.6% | |||||
| 15 | Hoboken | 59,369 | 47,384 | 25.3% | |||||
| 16 | New Brunswick | 55,671 | 53,933 | 3.2% | |||||
| 17 | Perth Amboy | 55,046 | 50,182 | 9.7% | |||||
| 18 | Plainfield | 54,183 | 49,043 | 10.5% | |||||
| 19 | West New York | 52,485 | 48,401 | 8.4% | |||||
| 20 | Hackensack | 45,723 | 42,713 | 7.0% | |||||
| 21 | Sayreville | 45,062 | 42,279 | 6.6% | |||||
| 22 | Linden | 43,387 | 39,967 | 8.6% | |||||
| 23 | Kearny | 41,790 | 40,208 | 3.9% | |||||
| 24 | Fort Lee | 39,701 | 35,161 | 12.9% | |||||
| 25 | Atlantic City | 38,481 | 40,081 | -4.0% | |||||
| 26 | Fair Lawn | 34,820 | 32,147 | 8.3% | |||||
| 27 | Garfield | 32,481 | 30,190 | 7.6% | |||||
| 28 | Long Branch | 31,734 | 30,855 | 2.8% | |||||
| 29 | Westfield | 30,950 | 29,950 | 3.3% | |||||
| 30 | Princeton | 30,717 | 0 | nan% | |||||
| 31 | Rahway | 29,582 | 26,968 | 9.7% | |||||
| 32 | Englewood | 29,129 | 26,828 | 8.6% | |||||
| 33 | Bergenfield | 28,282 | 26,517 | 6.7% | |||||
| 34 | Old Bridge | 28,252 | 23,324 | 21.1% | |||||
| 35 | Millville | 27,946 | 28,134 | -0.7% | |||||
| 36 | Paramus | 26,650 | 26,084 | 2.2% | |||||
| 37 | Bridgeton | 26,643 | 25,042 | 6.4% | |||||
| 38 | Ridgewood | 25,991 | 24,827 | 4.7% | |||||
| 39 | Lodi | 25,983 | 23,970 | 8.4% | |||||
| 40 | Cliffside Park | 25,515 | 23,365 | 9.2% | |||||
| 41 | Carteret | 25,077 | 22,445 | 11.7% | |||||
| 42 | Somerset | 24,827 | 22,385 | 10.9% | |||||
| 43 | South Plainfield | 24,251 | 23,090 | 5.0% | |||||
| 44 | North Plainfield | 22,635 | 21,932 | 3.2% | |||||
| 45 | Summit | 22,598 | 21,217 | 6.5% | |||||
| 46 | Roselle | 22,511 | 20,955 | 7.4% | |||||
| 47 | Secaucus | 21,439 | 16,008 | 33.9% | |||||
| 48 | Woodbridge | 21,314 | 19,234 | 10.8% | |||||
| 49 | Elmwood Park | 21,239 | 19,214 | 10.5% | |||||
| 50 | Lindenwold | 21,048 | 17,601 | 19.6% | |||||
| 51 | Pleasantville | 20,505 | 20,210 | 1.5% | |||||
| 52 | Palisades Park | 20,291 | 19,065 | 6.4% | |||||
| 53 | Glassboro | 20,284 | 18,811 | 7.8% | |||||
| 54 | Morristown | 20,003 | 18,457 | 8.4% | |||||
| 55 | Hawthorne | 19,507 | 18,574 | 5.0% | |||||
| 56 | Tinton Falls | 19,053 | 17,532 | 8.7% | |||||
| 57 | Point Pleasant | 18,839 | 18,704 | 0.7% | |||||
| 58 | Harrison | 18,824 | 13,569 | 38.7% | |||||
| 59 | Rutherford | 18,781 | 17,970 | 4.5% | |||||
| 60 | Colonia | 18,776 | 18,100 | 3.7% | |||||
| 61 | Dover | 18,418 | 18,222 | 1.1% | |||||
| 62 | Dumont | 17,965 | 17,386 | 3.3% | |||||
| 63 | Ocean Acres | 17,886 | 15,772 | 13.4% | |||||
| 64 | Iselin | 17,684 | 18,726 | -5.6% | |||||
| 65 | Avenel | 17,132 | 17,087 | 0.3% | |||||
| 66 | New Milford | 16,912 | 16,260 | 4.0% | |||||
| 67 | Madison | 16,819 | 15,846 | 6.1% | |||||
| 68 | North Arlington | 16,339 | 15,271 | 7.0% | |||||
| 69 | South River | 16,087 | 15,862 | 1.4% | |||||
| 70 | Princeton Meadows | 15,491 | 13,737 | 12.8% | |||||
| 71 | Springdale | 15,393 | 14,696 | 4.7% | |||||
| 72 | Tenafly | 15,307 | 14,276 | 7.2% | |||||
| 73 | Asbury Park | 15,305 | 16,275 | -6.0% | |||||
| 74 | Phillipsburg | 15,146 | 15,197 | -0.3% | |||||
| 75 | Williamstown | 14,947 | 14,232 | 5.0% | |||||
| 76 | Highland Park | 14,947 | 13,990 | 6.8% | |||||
| 77 | Fairview | 14,918 | 13,656 | 9.2% | |||||
| 78 | Metuchen | 14,883 | 13,431 | 10.8% | |||||
| 79 | Ramsey | 14,801 | 14,376 | 3.0% | |||||
| 80 | Bradley Gardens | 14,798 | 14,398 | 2.8% | |||||
| 81 | Hammonton | 14,695 | 14,655 | 0.3% | |||||
| 82 | West Freehold | 14,565 | 13,917 | 4.7% | |||||
| 83 | Middlesex | 14,513 | 13,652 | 6.3% | |||||
| 84 | Short Hills | 14,500 | 13,209 | 9.8% | |||||
| 85 | Hopatcong | 14,395 | 15,440 | -6.8% | |||||
| 86 | Moorestown-Lenola | 14,394 | 13,681 | 5.2% | |||||
| 87 | Mercerville | 14,234 | 12,662 | 12.4% | |||||
| 88 | Edgewater | 14,234 | 10,766 | 32.2% | |||||
| 89 | Collingswood | 14,087 | 14,024 | 0.4% | |||||
| 90 | Roselle Park | 13,973 | 13,179 | 6.0% | |||||
| 91 | Cherry Hill Mall | 13,826 | 13,973 | -1.1% | |||||
| 92 | Franklin Park | 13,686 | 12,624 | 8.4% | |||||
| 93 | Echelon | 13,668 | 10,049 | 36.0% | |||||
| 94 | New Providence | 13,570 | 12,018 | 12.9% | |||||
| 95 | Eato | 13,446 | 12,939 | 3.9% | |||||
| 96 | Woodland Park | 13,265 | 11,609 | 14.3% | |||||
| 97 | Ridgefield Park | 13,202 | 12,690 | 4.0% | |||||
| 98 | Fords | 12,897 | 15,084 | -14.5% | |||||
| 99 | Holiday City-Berkeley | 12,889 | 12,581 | 2.4% | |||||
| 100 | Red Bank | 12,825 | 12,131 | 5.7% | |||||
| 101 | Oakland | 12,773 | 12,642 | 1.0% | |||||
| 102 | Florham Park | 12,655 | 11,494 | 10.1% | |||||
| 103 | Freehold | 12,485 | 11,910 | 4.8% | |||||
| 104 | Somerville | 12,453 | 12,188 | 2.2% | |||||
| 105 | Haddonfield | 12,383 | 11,608 | 6.7% | |||||
| 106 | Robertsville | 12,365 | 11,039 | 12.0% | |||||
| 107 | Hamilton Square | 12,244 | 13,441 | -8.9% | |||||
| 108 | Hasbrouck Heights | 12,120 | 11,742 | 3.2% | |||||
| 109 | Glen Rock | 12,098 | 11,545 | 4.8% | |||||
| 110 | Pennsville | 12,093 | 11,922 | 1.4% | |||||
| 111 | Upper Montclair | 12,033 | 11,599 | 3.7% | |||||
| 112 | River Edge | 12,024 | 11,199 | 7.4% | |||||
| 113 | Martinsville | 11,980 | 11,461 | 4.5% | |||||
| 114 | Wallington | 11,833 | 11,328 | 4.5% | |||||
| 115 | Guttenberg | 11,833 | 10,960 | 8.0% | |||||
| 116 | Bound Brook | 11,799 | 10,399 | 13.5% | |||||
| 117 | Ringwood | 11,778 | 12,164 | -3.2% | |||||
| 118 | Bellmawr | 11,631 | 11,612 | 0.2% | |||||
| 119 | Ridgefield | 11,477 | 10,939 | 4.9% | |||||
| 120 | Gloucester City | 11,438 | 11,479 | -0.4% | |||||
| 121 | Wanaque | 11,285 | 10,891 | 3.6% | |||||
| 122 | Westwood | 11,267 | 10,873 | 3.6% | |||||
| 123 | Ocean City | 11,211 | 12,289 | -8.8% | |||||
| 124 | Pompton Lakes | 11,113 | 10,966 | 1.3% | |||||
| 125 | Franklin Lakes | 11,034 | 10,506 | 5.0% | |||||
| 126 | Totowa | 11,013 | 10,594 | 4.0% | |||||
| 127 | Little Ferry | 10,973 | 10,602 | 3.5% | |||||
| 128 | Lincoln Park | 10,877 | 10,630 | 2.3% | |||||
| 129 | Beachwood | 10,863 | 11,014 | -1.4% | |||||
| 130 | Manville | 10,861 | 10,364 | 4.8% | |||||
| 131 | Pine Hill | 10,637 | 10,354 | 2.7% | |||||
| 132 | Kendall Park | 10,560 | 8,805 | 19.9% | |||||
| 133 | Greentree | 10,517 | 11,460 | -8.2% | |||||
| 134 | Marlton | 10,491 | 10,310 | 1.8% | |||||
| 135 | Blackwells Mills | 10,488 | 698 | 1402.6% | |||||
| 136 | Somers Point | 10,470 | 11,038 | -5.1% | |||||
| 137 | Hackett | 10,221 | 9,704 | 5.3% | |||||
| 138 | Hillsdale | 10,166 | 10,141 | 0.2% | |||||
| 139 | Brookdale | 10,134 | 9,185 | 10.3% | |||||
| 140 | Waldwick | 10,086 | 9,580 | 5.3% | |||||
| 141 | Woodbury | 10,067 | 10,280 | -2.1% | |||||
| 142 | Browns Mills | 10,053 | 11,129 | -9.7% | |||||
| 143 | Maywood | 10,049 | 9,503 | 5.7% | |||||
| 144 | Kinnelon | 9,994 | 10,176 | -1.8% | |||||
| 145 | Budd Lake | 9,971 | 8,374 | 19.1% | |||||
| 146 | East Rutherford | 9,918 | 8,829 | 12.3% | |||||
| 147 | Villas | 9,866 | 9,442 | 4.5% | |||||
| 148 | Wood-Ridge | 9,865 | 7,572 | 30.3% | |||||
| 149 | Burlington | 9,800 | 9,953 | -1.5% | |||||
| 150 | Keansburg | 9,781 | 10,227 | -4.4% | |||||
| 151 | Monmouth Junction | 9,728 | 2,772 | 250.9% | |||||
| 152 | White Horse | 9,710 | 9,141 | 6.2% | |||||
| 153 | Succasunna | 9,530 | 8,977 | 6.2% | |||||
| 154 | Lake Mohawk | 9,503 | 10,035 | -5.3% | |||||
| 155 | Matawan | 9,486 | 8,786 | 8.0% | |||||
| 156 | Ventnor City | 9,333 | 11,151 | -16.3% | |||||
| 157 | South Amboy | 9,320 | 8,502 | 9.6% | |||||
| 158 | Leonia | 9,283 | 8,890 | 4.4% | |||||
| 159 | Ashland | 9,248 | 8,640 | 7.0% | |||||
| 160 | Chatham | 9,208 | 8,892 | 3.6% | |||||
| 161 | Pine Lake Park | 9,148 | 8,138 | 12.4% | |||||
| 162 | Smithville | 9,127 | 6,045 | 51.0% | |||||
| 163 | Cresskill | 9,096 | 8,380 | 8.5% | |||||
| 164 | White Meadow Lake | 9,069 | 8,377 | 8.3% | |||||
| 165 | Absecon | 9,039 | 8,357 | 8.2% | |||||
| 166 | Park Ridge | 8,987 | 8,615 | 4.3% | |||||
| 167 | Haledon | 8,936 | 8,245 | 8.4% | |||||
| 168 | North Haledon | 8,893 | 8,186 | 8.6% | |||||
| 169 | Bogota | 8,830 | 8,158 | 8.2% | |||||
| 170 | Clayton | 8,818 | 8,063 | 9.4% | |||||
| 171 | Pitman | 8,812 | 9,154 | -3.7% | |||||
| 172 | Caldwell | 8,800 | 7,745 | 13.6% | |||||
| 173 | Boonton | 8,770 | 8,405 | 4.3% | |||||
| 174 | Audubon | 8,693 | 8,900 | -2.3% | |||||
| 175 | Closter | 8,573 | 8,318 | 3.1% | |||||
| 176 | West Long Branch | 8,470 | 8,115 | 4.4% | |||||
| 177 | Newton | 8,423 | 8,121 | 3.7% | |||||
| 178 | Northfield | 8,419 | 8,559 | -1.6% | |||||
| 179 | Crestwood Village | 8,414 | 8,136 | 3.4% | |||||
| 180 | Montvale | 8,413 | 7,663 | 9.8% | |||||
| 181 | Kenilworth | 8,377 | 7,810 | 7.3% | |||||
| 182 | East Franklin | 8,375 | 7,710 | 8.6% | |||||
| 183 | Upper Saddle River | 8,352 | 8,085 | 3.3% | |||||
| 184 | Pomona | 8,340 | 5,313 | 57.0% | |||||
| 185 | Runnemede | 8,316 | 8,487 | -2.0% | |||||
| 186 | Oradell | 8,236 | 7,936 | 3.8% | |||||
| 187 | Dayton | 8,185 | 7,449 | 9.9% | |||||
| 188 | Spotswood | 8,163 | 8,196 | -0.4% | |||||
| 189 | Carneys Point | 8,091 | 7,016 | 15.3% | |||||
| 190 | Twin Rivers | 8,049 | 7,053 | 14.1% | |||||
| 191 | Butler | 8,019 | 7,515 | 6.7% | |||||
| 192 | Madison Park | 8,014 | 6,843 | 17.1% | |||||
| 193 | Raritan | 7,993 | 6,814 | 17.3% | |||||
| 194 | Fort Dix | 7,904 | 5,206 | 51.8% | |||||
| 195 | Brigantine | 7,890 | 10,115 | -22.0% | |||||
| 196 | Bernardsville | 7,862 | 7,652 | 2.7% | |||||
| 197 | Glen Ridge | 7,764 | 7,441 | 4.3% | |||||
| 198 | Bloomingdale | 7,759 | 7,581 | 2.3% | |||||
| 199 | Fanwood | 7,727 | 7,228 | 6.9% | |||||
| 200 | Mystic Island | 7,679 | 8,533 | -10.0% | |||||
| 201 | Dunellen | 7,580 | 7,143 | 6.1% | |||||
| 202 | Berlin | 7,484 | 7,357 | 1.7% | |||||
| 203 | Haddon Heights | 7,453 | 7,500 | -0.6% | |||||
| 204 | Palmyra | 7,429 | 7,416 | 0.2% | |||||
| 205 | Emerson | 7,317 | 7,329 | -0.2% | |||||
| 206 | Yorketown | 7,316 | 6,552 | 11.7% | |||||
| 207 | Rumson | 7,292 | 7,140 | 2.1% | |||||
| 208 | Keyport | 7,204 | 7,312 | -1.5% | |||||
| 209 | Wharton | 7,175 | 6,496 | 10.5% | |||||
| 210 | Washington | 7,172 | 6,591 | 8.8% | |||||
| 211 | Strathmore | 7,119 | 7,249 | -1.8% | |||||
| 212 | Heathcote | 7,056 | 5,698 | 23.8% | |||||
| 213 | Midland Park | 7,041 | 7,049 | -0.1% | |||||
| 214 | Barrington | 7,031 | 7,021 | 0.1% | |||||
| 215 | Mil | 7,019 | 6,895 | 1.8% | |||||
| 216 | Mountainside | 7,003 | 6,616 | 5.8% | |||||
| 217 | Stratford | 6,967 | 7,088 | -1.7% | |||||
| 218 | Linwood | 6,957 | 7,176 | -3.1% | |||||
| 219 | Kingston Estates | 6,825 | 5,781 | 18.1% | |||||
| 220 | Allendale | 6,820 | 6,489 | 5.1% | |||||
| 221 | Lincroft | 6,812 | 6,281 | 8.5% | |||||
| 222 | North Caldwell | 6,633 | 6,359 | 4.3% | |||||
| 223 | Rockaway | 6,587 | 6,458 | 2.0% | |||||
| 224 | Mays Landing | 6,555 | 2,220 | 195.3% | |||||
| 225 | Ramtown | 6,540 | 5,977 | 9.4% | |||||
| 226 | Watchung | 6,483 | 5,686 | 14.0% | |||||
| 227 | Green Knoll | 6,480 | 5,571 | 16.3% | |||||
| 228 | Carlstadt | 6,358 | 6,060 | 4.9% | |||||
| 229 | Ramblewood | 6,340 | 6,773 | -6.4% | |||||
| 230 | Prospect Park | 6,301 | 5,833 | 8.0% | |||||
| 231 | Laurence Harbor | 6,292 | 5,984 | 5.1% | |||||
| 232 | Yardville | 6,242 | 7,517 | -17.0% | |||||
| 233 | Roseland | 6,240 | 5,686 | 9.7% | |||||
| 234 | Fair Haven | 6,235 | 6,099 | 2.2% | |||||
| 235 | Paulsboro | 6,234 | 6,169 | 1.1% | |||||
| 236 | Oceanport | 6,115 | 5,842 | 4.7% | |||||
| 237 | Woodcliff Lake | 6,112 | 5,694 | 7.3% | |||||
| 238 | Little Silver | 6,103 | 5,987 | 1.9% | |||||
| 239 | Morris Plains | 6,081 | 5,558 | 9.4% | |||||
| 240 | Finderne | 6,052 | 6,180 | -2.1% | |||||
| 241 | Leisure Village | 6,001 | 4,543 | 32.1% | |||||
| 242 | Manasquan | 5,930 | 5,975 | -0.8% | |||||
| 243 | Old Tappan | 5,870 | 5,676 | 3.4% | |||||
| 244 | Belmar | 5,869 | 5,844 | 0.4% | |||||
| 245 | Hight | 5,855 | 5,475 | 6.9% | |||||
| 246 | Mount Arlington | 5,812 | 4,992 | 16.4% | |||||
| 247 | Jamesburg | 5,784 | 5,882 | -1.7% | |||||
| 248 | Union Beach | 5,781 | 6,324 | -8.6% | |||||
| 249 | Belle Mead | 5,754 | 124 | 4540.3% | |||||
| 250 | Norwood | 5,666 | 5,682 | -0.3% | |||||
| 251 | Franklin Center | 5,532 | 3,921 | 41.1% | |||||
| 252 | Glendora | 5,511 | 4,887 | 12.8% | |||||
| 253 | Somerdale | 5,476 | 5,197 | 5.4% | |||||
| 254 | Margate City | 5,402 | 6,763 | -20.1% | |||||
| 255 | Beckett | 5,371 | 4,777 | 12.4% | |||||
| 256 | Englewood Cliffs | 5,358 | 5,266 | 1.7% | |||||
| 257 | Clementon | 5,271 | 5,021 | 5.0% | |||||
| 258 | Salem | 5,237 | 5,289 | -1.0% | |||||
| 259 | Mcguire Afb | 5,216 | 4,682 | 11.4% | |||||
| 260 | Forked River | 5,139 | 4,945 | 3.9% | |||||
| 261 | Cape May Court House | 5,123 | 5,175 | -1.0% | |||||
| 262 | Wildwood | 5,113 | 5,321 | -3.9% | |||||
| 263 | Ellisburg | 5,093 | 4,488 | 13.5% | |||||
| 264 | Morganville | 5,061 | 4,619 | 9.6% | |||||
| 265 | Demarest | 4,977 | 4,850 | 2.6% | |||||
| 266 | Mendham | 4,976 | 5,022 | -0.9% | |||||
| 267 | Brielle | 4,955 | 4,795 | 3.3% | |||||
| 268 | Franklin | 4,904 | 5,116 | -4.1% | |||||
| 269 | Spring Lake Heights | 4,871 | 4,810 | 1.3% | |||||
| 270 | East Freehold | 4,865 | 5,101 | -4.6% | |||||
| 271 | Penns Grove | 4,836 | 5,118 | -5.5% | |||||
| 272 | Flemington | 4,819 | 4,549 | 5.9% | |||||
| 273 | South Bound Brook | 4,818 | 4,566 | 5.5% | |||||
| 274 | Harrington Park | 4,801 | 4,655 | 3.1% | |||||
| 275 | Northvale | 4,762 | 4,585 | 3.9% | |||||
| 276 | Point Pleasant Beach | 4,748 | 4,824 | -1.6% | |||||
| 277 | Beach Haven West | 4,729 | 4,178 | 13.2% | |||||
| 278 | Golden Triangle | 4,710 | 3,728 | 26.3% | |||||
| 279 | Florence | 4,672 | 4,629 | 0.9% | |||||
| 280 | Highlands | 4,669 | 5,063 | -7.8% | |||||
| 281 | Neptune City | 4,637 | 4,916 | -5.7% | |||||
| 282 | Mount Ephraim | 4,632 | 4,659 | -0.6% | |||||
| 283 | Leisure Village East | 4,598 | 4,665 | -1.4% | |||||
| 284 | Wanamassa | 4,513 | 4,370 | 3.3% | |||||
| 285 | Highland Lakes | 4,493 | 0 | nan% | |||||
| 286 | Buena | 4,489 | 4,510 | -0.5% | |||||
| 287 | Beattystown | 4,481 | 4,670 | -4.0% | |||||
| 288 | Blackwood | 4,477 | 5,026 | -10.9% | |||||
| 289 | Mountain Lakes | 4,464 | 4,183 | 6.7% | |||||
| 290 | Garwood | 4,425 | 4,175 | 6.0% | |||||
| 291 | Atlantic Highlands | 4,414 | 4,442 | -0.6% | |||||
| 292 | Barclay | 4,397 | 4,283 | 2.7% | |||||
| 293 | Panther Valley | 4,377 | 3,282 | 33.4% | |||||
| 294 | Egg Harbor City | 4,368 | 4,335 | 0.8% | |||||
| 295 | Magnolia | 4,329 | 4,364 | -0.8% | |||||
| 296 | Oak Valley | 4,322 | 3,678 | 17.5% | |||||
| 297 | Westville | 4,303 | 4,374 | -1.6% | |||||
| 298 | Bradley Beach | 4,284 | 4,395 | -2.5% | |||||
| 299 | Country Lake Estates | 4,251 | 3,752 | 13.3% | |||||
| 300 | Ho-Ho-Kus | 4,248 | 4,056 | 4.7% | |||||
| 301 | Medford Lakes | 4,240 | 4,179 | 1.5% | |||||
| 302 | Singac | 4,145 | 4,035 | 2.7% | |||||
| 303 | Mullica Hill | 4,139 | 4,748 | -12.8% | |||||
| 304 | Shrewsbury | 4,129 | 3,771 | 9.5% | |||||
| 305 | Roebling | 4,121 | 3,936 | 4.7% | |||||
| 306 | Lambertville | 4,116 | 3,932 | 4.7% | |||||
| 307 | Holiday City South | 4,077 | 3,833 | 6.4% | |||||
| 308 | Riverdale | 4,049 | 3,372 | 20.1% | |||||
| 309 | Leisure Village West | 4,019 | 3,518 | 14.2% | |||||
| 310 | White House Station | 3,991 | 2,167 | 84.2% | |||||
| 311 | Bordentown | 3,975 | 3,978 | -0.1% | |||||
| 312 | Port Reading | 3,928 | 3,563 | 10.2% | |||||
| 313 | Oaklyn | 3,922 | 4,070 | -3.6% | |||||
| 314 | Richwood | 3,878 | 2,947 | 31.6% | |||||
| 315 | Port Monmouth | 3,852 | 4,468 | -13.8% | |||||
| 316 | Oakhurst | 3,810 | 4,213 | -9.6% | |||||
| 317 | Merchantville | 3,797 | 3,835 | -1.0% | |||||
| 318 | North Cape May | 3,776 | 3,184 | 18.6% | |||||
| 319 | Barnegat | 3,670 | 2,850 | 28.8% | |||||
| 320 | Lawrenceville | 3,661 | 3,556 | 3.0% | |||||
| 321 | South Toms River | 3,641 | 3,707 | -1.8% | |||||
| 322 | Wood | 3,638 | 3,453 | 5.4% | |||||
| 323 | North Wildwood | 3,625 | 4,175 | -13.2% | |||||
| 324 | Tuckerton | 3,558 | 3,407 | 4.4% | |||||
| 325 | High Bridge | 3,547 | 3,706 | -4.3% | |||||
| 326 | Rio Grande | 3,530 | 2,170 | 62.7% | |||||
| 327 | Stanhope | 3,515 | 3,647 | -3.6% | |||||
| 328 | Gibbstown | 3,500 | 3,872 | -9.6% | |||||
| 329 | Netcong | 3,418 | 3,247 | 5.3% | |||||
| 330 | Saddle River | 3,362 | 3,137 | 7.2% | |||||
| 331 | Turnersville | 3,345 | 3,429 | -2.4% | |||||
| 332 | Sewaren | 3,342 | 2,612 | 27.9% | |||||
| 333 | Haworth | 3,341 | 3,374 | -1.0% | |||||
| 334 | Six Mile Run | 3,334 | 3,634 | -8.3% | |||||
| 335 | Hamburg | 3,262 | 3,280 | -0.5% | |||||
| 336 | Groveville | 3,257 | 3,576 | -8.9% | |||||
| 337 | Leisuretowne | 3,209 | 3,405 | -5.8% | |||||
| 338 | Monmouth Beach | 3,197 | 3,351 | -4.6% | |||||
| 339 | Woodbury Heights | 3,125 | 3,074 | 1.7% | |||||
| 340 | Wildwood Crest | 3,084 | 3,374 | -8.6% | |||||
| 341 | Moonachie | 3,079 | 2,706 | 13.8% | |||||
| 342 | National Park | 3,064 | 3,109 | -1.4% | |||||
| 343 | Shark River Hills | 3,043 | 3,784 | -19.6% | |||||
| 344 | Cliffwood Beach | 3,037 | 3,058 | -0.7% | |||||
| 345 | East Newark | 3,021 | 2,378 | 27.0% | |||||
| 346 | Lawnside | 2,980 | 2,898 | 2.8% | |||||
| 347 | Ocean Grove | 2,962 | 3,622 | -18.2% | |||||
| 348 | Cape May | 2,922 | 3,687 | -20.7% | |||||
| 349 | Woodlynne | 2,902 | 2,949 | -1.6% | |||||
| 350 | Spring Lake | 2,814 | 3,092 | -9.0% | |||||
| 351 | Rossmoor | 2,780 | 2,866 | -3.0% | |||||
| 352 | Pennington | 2,777 | 2,605 | 6.6% | |||||
| 353 | Plainsboro Center | 2,768 | 2,690 | 2.9% | |||||
| 354 | Riverton | 2,761 | 2,806 | -1.6% | |||||
| 355 | Pemberton Heights | 2,759 | 2,667 | 3.4% | |||||
| 356 | Clinton | 2,758 | 2,726 | 1.2% | |||||
| 357 | Concordia | 2,746 | 3,203 | -14.3% | |||||
| 358 | Swedesboro | 2,721 | 2,528 | 7.6% | |||||
| 359 | Leisure Knoll | 2,653 | 2,524 | 5.1% | |||||
| 360 | Pine Ridge At Crestwood | 2,639 | 2,420 | 9.0% | |||||
| 361 | Lakehurst | 2,629 | 2,661 | -1.2% | |||||
| 362 | Peapack And Gladstone | 2,611 | 2,562 | 1.9% | |||||
| 363 | Belvidere | 2,525 | 2,734 | -7.6% | |||||
| 364 | Middlebush | 2,461 | 2,014 | 22.2% | |||||
| 365 | West Belmar | 2,458 | 2,377 | 3.4% | |||||
| 366 | North Middletown | 2,442 | 2,954 | -17.3% | |||||
| 367 | Vista Center | 2,440 | 1,489 | 63.9% | |||||
| 368 | Whittingham | 2,437 | 2,513 | -3.0% | |||||
| 369 | Laurel Lake | 2,396 | 3,050 | -21.4% | |||||
| 370 | Leonardo | 2,376 | 2,756 | -13.8% | |||||
| 371 | Brownville | 2,368 | 2,913 | -18.7% | |||||
| 372 | Helmetta | 2,365 | 2,103 | 12.5% | |||||
| 373 | Whitesboro | 2,361 | 2,307 | 2.3% | |||||
| 374 | Pine Beach | 2,318 | 2,134 | 8.6% | |||||
| 375 | Gibbsboro | 2,303 | 2,341 | -1.6% | |||||
| 376 | Alpha | 2,290 | 2,490 | -8.0% | |||||
| 377 | Woodbine | 2,288 | 2,461 | -7.0% | |||||
| 378 | Ten Mile Run | 2,281 | 1,793 | 27.2% | |||||
| 379 | North Beach Haven | 2,272 | 2,116 | 7.4% | |||||
| 380 | Essex Fells | 2,270 | 2,096 | 8.3% | |||||
| 381 | Wenonah | 2,269 | 2,212 | 2.6% | |||||
| 382 | Cranbury | 2,217 | 2,203 | 0.6% | |||||
| 383 | Princeton Junction | 2,208 | 2,308 | -4.3% | |||||
| 384 | Ogdensburg | 2,192 | 2,371 | -7.5% | |||||
| 385 | Byram Center | 2,186 | 13 | 16715.4% | |||||
| 386 | Seaside Heights | 2,161 | 2,967 | -27.2% | |||||
| 387 | Lavallette | 2,156 | 2,154 | 0.1% | |||||
| 388 | Holiday Heights | 2,150 | 2,222 | -3.2% | |||||
| 389 | Englis | 2,145 | 1,835 | 16.9% | |||||
| 390 | Waretown | 2,126 | 1,318 | 61.3% | |||||
| 391 | Long Valley | 2,108 | 1,885 | 11.8% | |||||
| 392 | Beverly | 2,107 | 2,638 | -20.1% | |||||
| 393 | Manahawkin | 2,097 | 1,673 | 25.3% | |||||
| 394 | Weston | 2,076 | 1,073 | 93.5% | |||||
| 395 | Sea Isle City | 2,068 | 2,127 | -2.8% | |||||
| 396 | Belford | 2,027 | 1,396 | 45.2% | |||||
| 397 | Presidential Lakes Estates | 2,006 | 2,853 | -29.7% | |||||
| 398 | Laurel Springs | 1,981 | 2,157 | -8.2% | |||||
| 399 | Erma | 1,957 | 2,141 | -8.6% | |||||
| 400 | Sea Girt | 1,945 | 1,951 | -0.3% | |||||
| 401 | Lebanon | 1,925 | 1,260 | 52.8% | |||||
| 402 | Sussex | 1,913 | 1,942 | -1.5% | |||||
| 403 | Kenvil | 1,905 | 2,977 | -36.0% | |||||
| 404 | Alle | 1,899 | 1,828 | 3.9% | |||||
| 405 | Hopewell | 1,841 | 1,992 | -7.6% | |||||
| 406 | Brooklawn | 1,837 | 1,697 | 8.2% | |||||
| 407 | Cedar Glen West | 1,827 | 1,311 | 39.4% | |||||
| 408 | Dover Beaches North | 1,826 | 1,505 | 21.3% | |||||
| 409 | Upper Pohatcong | 1,821 | 1,971 | -7.6% | |||||
| 410 | New Egypt | 1,813 | 2,182 | -16.9% | |||||
| 411 | Seaside Park | 1,804 | 1,838 | -1.8% | |||||
| 412 | Newfield | 1,795 | 1,687 | 6.4% | |||||
| 413 | Estell Manor | 1,762 | 1,650 | 6.8% | |||||
| 414 | Avon-By-The-Sea | 1,760 | 2,097 | -16.1% | |||||
| 415 | Lake Como | 1,746 | 1,813 | -3.7% | |||||
| 416 | Annandale | 1,742 | 1,212 | 43.7% | |||||
| 417 | Folsom | 1,725 | 1,740 | -0.9% | |||||
| 418 | Port Norris | 1,697 | 1,614 | 5.1% | |||||
| 419 | Frenc | 1,673 | 1,399 | 19.6% | |||||
| 420 | Victory Gardens | 1,666 | 1,742 | -4.4% | |||||
| 421 | Ocean Gate | 1,629 | 1,607 | 1.4% | |||||
| 422 | Glen Gardner | 1,627 | 1,881 | -13.5% | |||||
| 423 | Brass Castle | 1,620 | 1,372 | 18.1% | |||||
| 424 | Chester | 1,591 | 1,432 | 11.1% | |||||
| 425 | Voorhees | 1,586 | 1,025 | 54.7% | |||||
| 426 | Rosenhayn | 1,580 | 1,260 | 25.4% | |||||
| 427 | Collings Lakes | 1,548 | 1,491 | 3.8% | |||||
| 428 | Cedar Glen Lakes | 1,540 | 1,741 | -11.5% | |||||
| 429 | Sea Bright | 1,532 | 1,348 | 13.6% | |||||
| 430 | Island Heights | 1,521 | 1,386 | 9.7% | |||||
| 431 | Victory Lakes | 1,517 | 2,108 | -28.0% | |||||
| 432 | Vernon Center | 1,471 | 2,054 | -28.4% | |||||
| 433 | Olivet | 1,432 | 1,738 | -17.6% | |||||
| 434 | Chesilhurst | 1,421 | 1,565 | -9.2% | |||||
| 435 | Avalon | 1,404 | 1,914 | -26.6% | |||||
| 436 | Crandon Lakes | 1,400 | 1,292 | 8.4% | |||||
| 437 | Dover Beaches South | 1,378 | 1,345 | 2.5% | |||||
| 438 | Alloway | 1,360 | 1,211 | 12.3% | |||||
| 439 | Seabrook Farms | 1,355 | 1,433 | -5.4% | |||||
| 440 | Alpine | 1,336 | 1,926 | -30.6% | |||||
| 441 | Pemberton | 1,301 | 1,199 | 8.5% | |||||
| 442 | Elmer | 1,285 | 1,224 | 5.0% | |||||
| 443 | Farmingdale | 1,285 | 1,339 | -4.0% | |||||
| 444 | Vernon Valley | 1,279 | 1,701 | -24.8% | |||||
| 445 | Navesink | 1,278 | 2,292 | -44.2% | |||||
| 446 | Surf City | 1,259 | 1,455 | -13.5% | |||||
| 447 | Lake Telemark | 1,230 | 1,359 | -9.5% | |||||
| 448 | Oxford | 1,164 | 1,167 | -0.3% | |||||
| 449 | Milford | 1,141 | 1,181 | -3.4% | |||||
| 450 | Silver Ridge | 1,106 | 1,218 | -9.2% | |||||
| 451 | Beach Haven | 1,074 | 1,404 | -23.5% | |||||
| 452 | Port Republic | 1,058 | 1,102 | -4.0% | |||||
| 453 | Kingston | 1,041 | 1,980 | -47.4% | |||||
| 454 | Califon | 1,041 | 1,283 | -18.9% | |||||
| 455 | Audubon Park | 1,034 | 1,047 | -1.2% | |||||
| 456 | Brookfield | 1,024 | 745 | 37.4% | |||||
| 457 | West Cape May | 1,017 | 946 | 7.5% | |||||
| 458 | Hampton | 1,014 | 1,367 | -25.8% | |||||
| 459 | Roosevelt | 1,006 | 712 | 41.3% | |||||
| 460 | Far Hills | 1,001 | 848 | 18.0% | |||||
| 461 | Ship Bottom | 1,000 | 1,150 | -13.0% | |||||