

Every city has safe neighborhoods and dangerous neighborhhods. We believe you should know which neighborhoods in Chicago are the safest before you move.
Every year, more than 30 million Americans move. Sometimes, its for a job, other times its to escape the big city. But no matter where you move, you want a neighborhood thats family friendly, clean, and most importantly, safe.
Weve analyzed the FBI crime reports data on violent and property crimes for every single neighborhood in Chicago. Then, we calculated your chances of being the victim of a crime in each one.
What Chicago neighborhoods can you leave your doors unlocked at night? Heres the list.
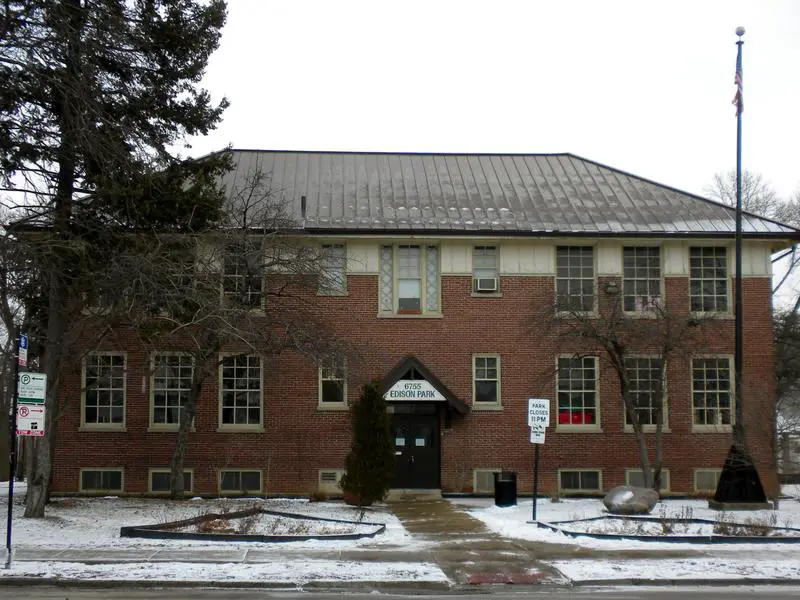
Which neighborhood is the safest in Chicago in 2024? That would be Edison Park. Thats according to the most recent FBI crime data, which takes into account everything from thefts and robberies to assaults and murders.
If you dont see a neighborhood youre looking for in our top , scroll down to the bottom, where we have all Chicago neighborhoods listed in order from safest to most dangerous.
For more Illinois reading, check out:
- Safest Cities To Live In America
- Safest States To Live In America
- Worst neighborhoods in Chicago
- Best neighborhoods to live in Chicago.
Table Of Contents: Top 10 | Methodology | Summary | Table
The 10 Safest Neighborhoods To Live In Chicago For 2024
/10
Population: 10,847
Violent Crimes Per 100k: 187
Property Crime Per 100k: 720
More on Edison Park: Data | Real Estate
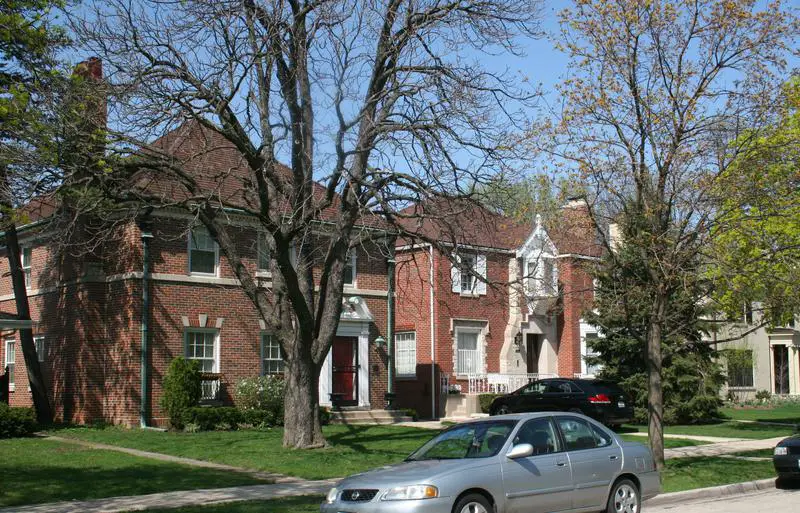
/10
Population: 981
Violent Crimes Per 100k: 169
Property Crime Per 100k: 966
More on Forest Glen: Data | Real Estate
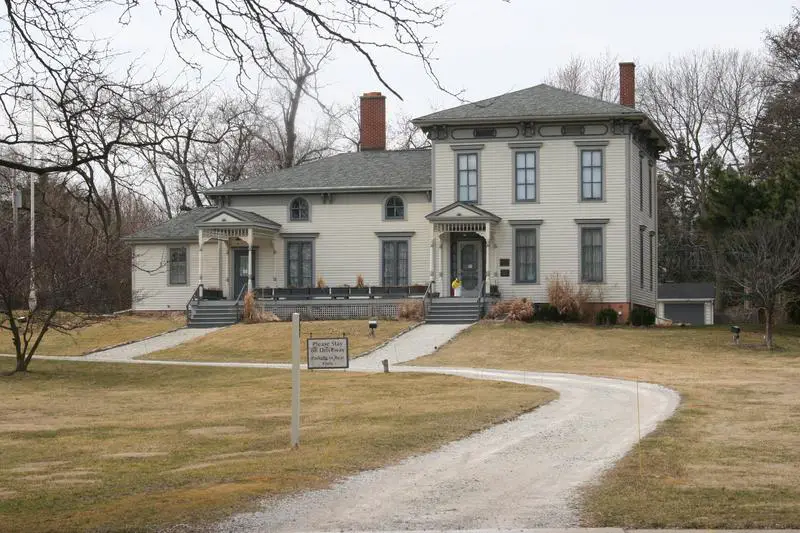
/10
Population: 37,477
Violent Crimes Per 100k: 219
Property Crime Per 100k: 891
More on Norwood Park: Data | Real Estate
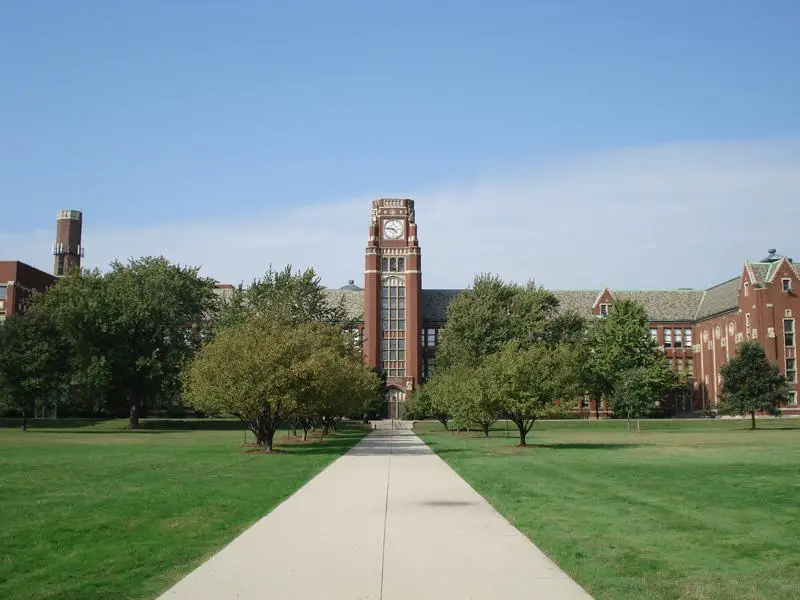
/10
Population: 16,972
Violent Crimes Per 100k: 212
Property Crime Per 100k: 1,027
More on Mount Greenwood: Data | Real Estate
/10
Population: 15,966
Violent Crimes Per 100k: 275
Property Crime Per 100k: 954
More on O’hare: Data | Real Estate
/10
Population: 24,934
Violent Crimes Per 100k: 268
Property Crime Per 100k: 1,095
More on Clearing: Data | Real Estate
/10
Population: 7,475
Violent Crimes Per 100k: 308
Property Crime Per 100k: 1,072
More on Dunning: Data | Real Estate
/10
Population: 44,365
Violent Crimes Per 100k: 292
Property Crime Per 100k: 1,237
More on Jefferson Park: Data | Real Estate
/10
Population: 20,512
Violent Crimes Per 100k: 203
Property Crime Per 100k: 1,503
More on North Center: Data | Real Estate
/10
Population: 13,407
Violent Crimes Per 100k: 245
Property Crime Per 100k: 1,487
More on Beverly: Data | Real Estate
Methodology: How We Determined The Safest Chicago Hoods In 2024
You can ask people which neighborhoods are the safest, or you can look at the unbiased raw data. We choose data.
Instead of relying on speculation and opinion, we used Saturday Night Science to analyze the numbers from the FBI’s most recent crime report for every neighborhood in Chicago.
To be more specific, we analyzed the FBI’s Uniform Crime Report. We then ran an analysis to calculate each neighborhood’s property and violent crimes per capita. We used the following criteria:
- Total Crimes Per Capita
- Violent Crimes Per Capita
- Property Crimes Per Capita
We then ranked each neighborhood with scores from 1 to 77 in each category, where 1 was the safest.
Next, we averaged the rankings for each neighborhood to create a safe neighborhood index.
Finally, we crowned the neighborhood with the lowest safest neighborhood index the “Safest City Neighborhood In Chicago.” We’re lookin’ at you, Edison Park.
We updated this article for 2024. This is our fourth time ranking the safest neighborhoods in Chicago.
Skip to the end to see the list of all the neighborhoods in the city, from safest to most expensive.
Summary: The Safest Places In Chicago
Looking at the data, you can tell that Edison Park is as safe as they come, according to science and data.
The safest neighborhoods in Chicago are Edison Park, Forest Glen, Norwood Park, Mount Greenwood, O’hare, Clearing, Dunning, Jefferson Park, North Center, and Beverly.
But as most Illinois residents would agree, almost every place here has its safe and not safe parts. So make sure you’re informed ahead of time.
The most dangerous neighborhoods in Chicago are West Garfield Park, East Garfield Park, North Lawndale, Washington Park, and Englewood.
We ranked the neighborhoods from safest to most dangerous in the chart below.
For more Illinois reading, check out:
- Best Places To Live In Illinois
- Cheapest Places To Live In Illinois
- Most Dangerous Cities In Illinois
- Richest Cities In Illinois
- Safest Places In Illinois
- Worst Places To Live In Illinois