
Every city has safe neighborhoods and dangerous neighborhhods. We believe you should know which neighborhoods in Cleveland are the safest before you move.
Every year, more than 30 million Americans move. Sometimes, its for a job, other times its to escape the big city. But no matter where you move, you want a neighborhood thats family friendly, clean, and most importantly, safe.
Weve analyzed the FBI crime reports data on violent and property crimes for every single neighborhood in Cleveland. Then, we calculated your chances of being the victim of a crime in each one.
What Cleveland neighborhoods can you leave your doors unlocked at night? Heres the list.
Which neighborhood is the safest in Cleveland in 2024? That would be Kamm’S Corner. Thats according to the most recent FBI crime data, which takes into account everything from thefts and robberies to assaults and murders.
If you dont see a neighborhood youre looking for in our top , scroll down to the bottom, where we have all Cleveland neighborhoods listed in order from safest to most dangerous.
For more Ohio reading, check out:
- Safest Cities To Live In America
- Safest States To Live In America
- Worst neighborhoods in Cleveland
- Best neighborhoods to live in Cleveland.
Table Of Contents: Top 10 | Methodology | Summary | Table
The 10 Safest Neighborhoods To Live In Cleveland For 2024

/10
Population: 20,271
Violent Crimes Per 100k: 663
Property Crime Per 100k: 1,628
More on Kamm’s Corner: Data | Real Estate

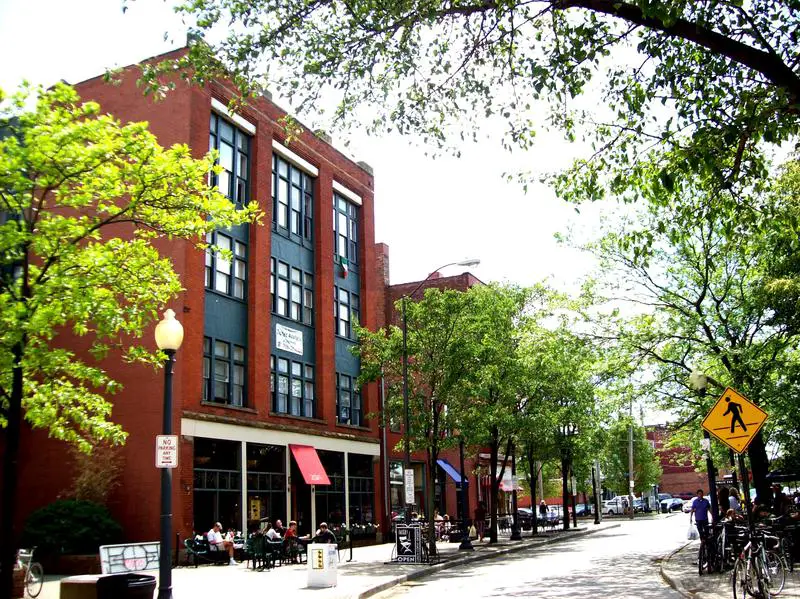
/10
Population: 6,903
Violent Crimes Per 100k: 663
Property Crime Per 100k: 1,628
More on Tremont: Data | Real Estate
/10
Population: 9,075
Violent Crimes Per 100k: 701
Property Crime Per 100k: 1,722
More on Ohio City-West Side: Data | Real Estate
/10
Population: 7,515
Violent Crimes Per 100k: 747
Property Crime Per 100k: 1,835
More on University District: Data | Real Estate
/10
Population: 11,655
Violent Crimes Per 100k: 832
Property Crime Per 100k: 2,045
More on Downtown: Data | Real Estate

/10
Population: 7,297
Violent Crimes Per 100k: 1,066
Property Crime Per 100k: 2,619
More on Edgewater: Data | Real Estate
/10
Population: 1,289
Violent Crimes Per 100k: 1,241
Property Crime Per 100k: 3,048
More on Riverside: Data | Real Estate

/10
Population: 32,541
Violent Crimes Per 100k: 1,393
Property Crime Per 100k: 3,422
More on Old Brooklyn: Data | Real Estate
/10
Population: 10,806
Violent Crimes Per 100k: 1,527
Property Crime Per 100k: 3,753
More on Buckeye Shaker: Data | Real Estate
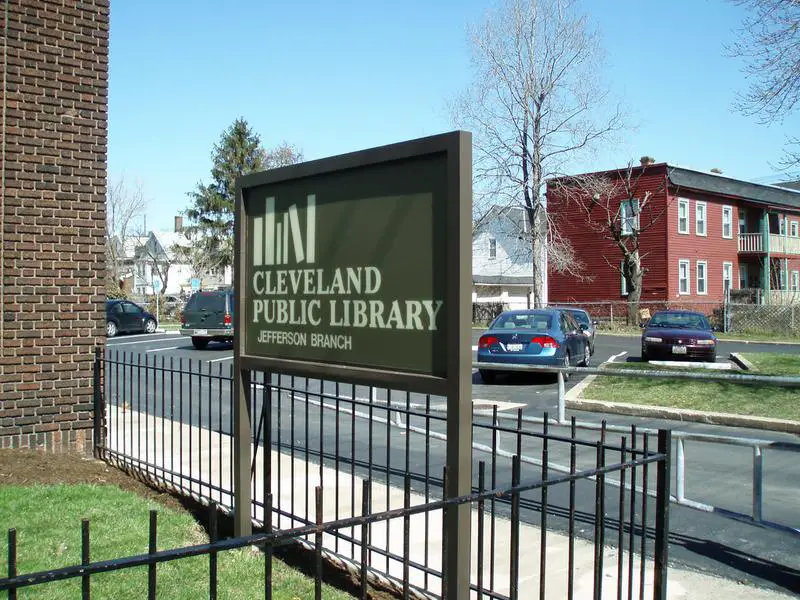
/10
Population: 18,226
Violent Crimes Per 100k: 1,554
Property Crime Per 100k: 3,819
More on Jefferson: Data | Real Estate
Methodology: How We Determined The Safest Cleveland Hoods In 2024
You can ask people which neighborhoods are the safest, or you can look at the unbiased raw data. We choose data.
Instead of relying on speculation and opinion, we used Saturday Night Science to analyze the numbers from the FBI’s most recent crime report for every neighborhood in Cleveland.
To be more specific, we analyzed the FBI’s Uniform Crime Report. We then ran an analysis to calculate each neighborhood’s property and violent crimes per capita. We used the following criteria:
- Total Crimes Per Capita
- Violent Crimes Per Capita
- Property Crimes Per Capita
We then ranked each neighborhood with scores from 1 to 36 in each category, where 1 was the safest.
Next, we averaged the rankings for each neighborhood to create a safe neighborhood index.
Finally, we crowned the neighborhood with the lowest safest neighborhood index the “Safest City Neighborhood In Cleveland.” We’re lookin’ at you, Kamm’S Corner.
We updated this article for 2024. This is our fourth time ranking the safest neighborhoods in Cleveland.
Skip to the end to see the list of all the neighborhoods in the city, from safest to most expensive.
Summary: The Safest Places In Cleveland
Looking at the data, you can tell that Kamm’S Corner is as safe as they come, according to science and data.
The safest neighborhoods in Cleveland are Kamm’s Corner, Tremont, Ohio City-West Side, University District, Downtown, Edgewater, Riverside, Old Brooklyn, Buckeye Shaker, and Jefferson.
But as most Ohio residents would agree, almost every place here has its safe and not safe parts. So make sure you’re informed ahead of time.
The most dangerous neighborhoods in Cleveland are Indurstrial Valley, North Broadway, Kinsmith, Central, and Stockyards.
We ranked the neighborhoods from safest to most dangerous in the chart below.
For more Ohio reading, check out:
- Best Places To Live In Ohio
- Cheapest Places To Live In Ohio
- Most Dangerous Cities In Ohio
- Richest Cities In Ohio
- Safest Places In Ohio
- Worst Places To Live In Ohio
Detailed List Of The Safest Neighborhoods To Live In Cleveland For 2024
| Rank | Neighborhood | Crime Per 100K |
|---|---|---|
| 1 | Kamm’s Corner | 2,291 |
| 2 | Tremont | 2,291 |
| 3 | Ohio City-West Side | 2,423 |
| 4 | University District | 2,582 |
| 5 | Downtown | 2,877 |
| 6 | Edgewater | 3,685 |
| 7 | Riverside | 4,289 |
| 8 | Old Brooklyn | 4,815 |
| 9 | Buckeye Shaker | 5,281 |
| 10 | Jefferson | 5,373 |
| 11 | Detroit Shoreway | 5,381 |
| 12 | Lee Miles | 5,559 |
| 13 | North Collinwood | 5,742 |
| 14 | Puritas Longmead | 5,871 |
| 15 | Goodrich-Kirkland | 6,109 |
| 16 | Euclid Green | 6,280 |
| 17 | Hough | 6,344 |
| 18 | Brooklyn Center | 6,399 |
| 19 | West Boulevard | 6,529 |
| 20 | Mt Pleasant | 6,817 |
| 21 | Corlett | 6,905 |
| 22 | Forest Hills | 6,923 |
| 23 | South Collinwood | 7,026 |
| 24 | Cudell | 7,142 |
| 25 | Clark Fulton | 7,195 |
| 26 | Glenville | 7,197 |
| 27 | South Broadway | 7,234 |
| 28 | Saint Claire-Superior | 7,386 |
| 29 | Union Miles Park | 7,693 |
| 30 | Fairfax | 7,995 |
| 31 | Woodland Hills | 8,013 |
| 32 | Stockyards | 8,055 |
| 33 | Central | 8,103 |
| 34 | Kinsmith | 8,243 |
| 35 | North Broadway | 8,530 |
| 36 | Indurstrial Valley | 9,164 |