
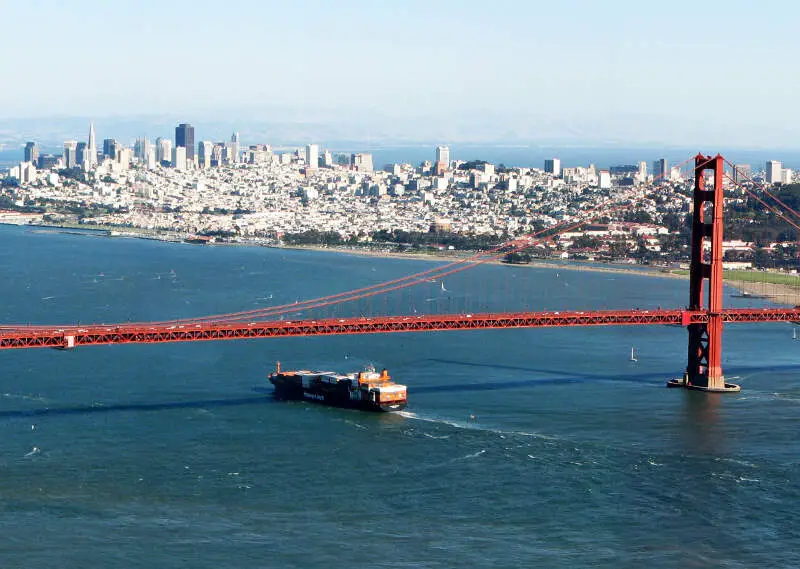
Every city has safe neighborhoods and dangerous neighborhhods. We believe you should know which neighborhoods in San Francisco are the safest before you move.
Every year, more than 30 million Americans move. Sometimes, its for a job, other times its to escape the big city. But no matter where you move, you want a neighborhood thats family friendly, clean, and most importantly, safe.
Weve analyzed the FBI crime reports data on violent and property crimes for every single neighborhood in San Francisco. Then, we calculated your chances of being the victim of a crime in each one.
What San Francisco neighborhoods can you leave your doors unlocked at night? Heres the list.
Which neighborhood is the safest in San Francisco in 2024? That would be Inner Sunset. Thats according to the most recent FBI crime data, which takes into account everything from thefts and robberies to assaults and murders.
If you dont see a neighborhood youre looking for in our top , scroll down to the bottom, where we have all San Francisco neighborhoods listed in order from safest to most dangerous.
For more California reading, check out:
- Safest Cities To Live In America
- Safest States To Live In America
- Worst neighborhoods in San Francisco
- Best neighborhoods to live in San Francisco.
Table Of Contents: Top 10 | Methodology | Summary | Table
The 10 Safest Neighborhoods To Live In San Francisco For 2024
/10
Population: 17,334
Violent Crimes Per 100k: 140
Property Crime Per 100k: 1,680
More on Inner Sunset: Data | Real Estate
/10
Population: 18,347
Violent Crimes Per 100k: 174
Property Crime Per 100k: 1,060
More on Outer Sunset: Data | Real Estate
/10
Population: 13,076
Violent Crimes Per 100k: 220
Property Crime Per 100k: 821
More on Crocker Amazon: Data | Real Estate

/10
Population: 16,095
Violent Crimes Per 100k: 129
Property Crime Per 100k: 1,764
More on Noe Valley: Data | Real Estate
/10
Population: 30,618
Violent Crimes Per 100k: 221
Property Crime Per 100k: 1,222
More on Ocean View: Data | Real Estate
/10
Population: 16,587
Violent Crimes Per 100k: 165
Property Crime Per 100k: 1,749
More on Outer Richmond: Data | Real Estate
/10
Population: 19,022
Violent Crimes Per 100k: 167
Property Crime Per 100k: 2,161
More on Inner Richmond: Data | Real Estate
/10
Population: 9,165
Violent Crimes Per 100k: 174
Property Crime Per 100k: 2,166
More on Glen Park: Data | Real Estate
/10
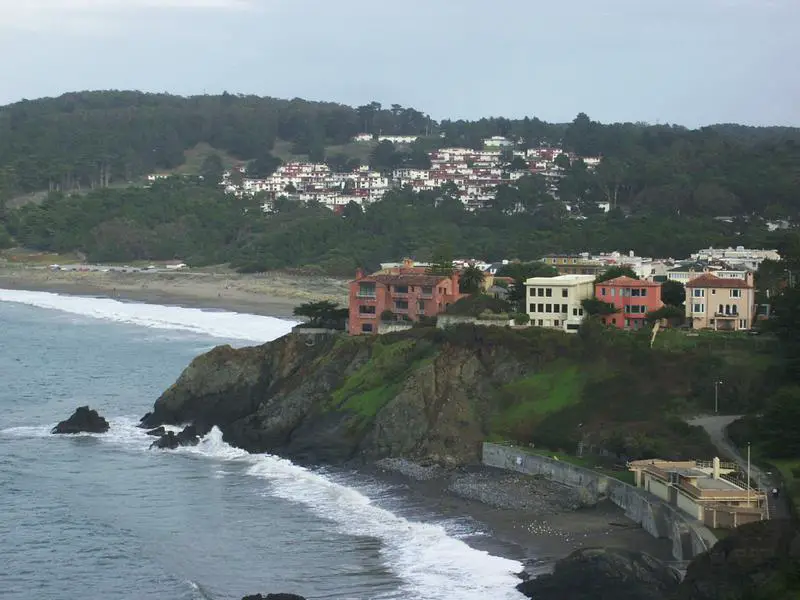
Population: 1,429
Violent Crimes Per 100k: 247
Property Crime Per 100k: 1,991
More on Seacliff: Data | Real Estate
/10
Population: 4,672
Violent Crimes Per 100k: 159
Property Crime Per 100k: 2,454
More on Presidio Heights: Data | Real Estate
Methodology: How We Determined The Safest San Francisco Hoods In 2024
You can ask people which neighborhoods are the safest, or you can look at the unbiased raw data. We choose data.
Instead of relying on speculation and opinion, we used Saturday Night Science to analyze the numbers from the FBI’s most recent crime report for every neighborhood in San Francisco.
To be more specific, we analyzed the FBI’s Uniform Crime Report. We then ran an analysis to calculate each neighborhood’s property and violent crimes per capita. We used the following criteria:
- Total Crimes Per Capita
- Violent Crimes Per Capita
- Property Crimes Per Capita
We then ranked each neighborhood with scores from 1 to 34 in each category, where 1 was the safest.
Next, we averaged the rankings for each neighborhood to create a safe neighborhood index.
Finally, we crowned the neighborhood with the lowest safest neighborhood index the “Safest City Neighborhood In San Francisco.” We’re lookin’ at you, Inner Sunset.
We updated this article for 2024. This is our fourth time ranking the safest neighborhoods in San Francisco.
Skip to the end to see the list of all the neighborhoods in the city, from safest to most expensive.
Summary: The Safest Places In San Francisco
Looking at the data, you can tell that Inner Sunset is as safe as they come, according to science and data.
The safest neighborhoods in San Francisco are Inner Sunset, Outer Sunset, Crocker Amazon, Noe Valley, Ocean View, Outer Richmond, Inner Richmond, Glen Park, Seacliff, and Presidio Heights.
But as most California residents would agree, almost every place here has its safe and not safe parts. So make sure you’re informed ahead of time.
The most dangerous neighborhoods in San Francisco are Downtown, Mission, Potrero Hill, Castro-Upper Market, and Western Addition.
We ranked the neighborhoods from safest to most dangerous in the chart below.
For more California reading, check out:
- Best Places To Live In California
- Cheapest Places To Live In California
- Most Dangerous Cities In California
- Richest Cities In California
- Safest Places In California
- Worst Places To Live In California
Detailed List Of The Safest Neighborhoods To Live In San Francisco For 2024
| Rank | Neighborhood | Crime Per 100K |
|---|---|---|
| 1 | Inner Sunset | 1,820 |
| 2 | Outer Sunset | 1,234 |
| 3 | Crocker Amazon | 1,041 |
| 4 | Noe Valley | 1,893 |
| 5 | Ocean View | 1,443 |
| 6 | Outer Richmond | 1,914 |
| 7 | Inner Richmond | 2,328 |
| 8 | Glen Park | 2,340 |
| 9 | Seacliff | 2,238 |
| 10 | Presidio Heights | 2,613 |
| 11 | Excelsior | 2,068 |
| 12 | Parkside | 2,668 |
| 13 | West Of Twin Peaks | 2,463 |
| 14 | Twin Peaks | 2,639 |
| 15 | Visitacion Valley | 2,219 |
| 16 | Pacific Heights | 3,204 |
| 17 | Outer Mission | 2,515 |
| 18 | Bernal Heights | 2,624 |
| 19 | Nob Hill | 3,344 |
| 20 | Diamond Heights | 3,503 |
| 21 | Lakeshore | 3,672 |
| 22 | Haight-Ashbury | 3,985 |
| 23 | Financial District | 3,941 |
| 24 | Marina | 5,270 |
| 25 | North Beach | 4,305 |
| 26 | South Of Market | 5,202 |
| 27 | Russian Hill | 6,456 |
| 28 | Chinatown | 5,676 |
| 29 | Bayview | 5,677 |
| 30 | Western Addition | 6,720 |
| 31 | Castro-Upper Market | 6,725 |
| 32 | Potrero Hill | 7,934 |
| 33 | Mission | 8,236 |
| 34 | Downtown | 14,719 |