Cayce, SC
Demographics And Statistics
Living In Cayce, South Carolina Summary
Life in Cayce research summary. HomeSnacks has been using Saturday Night Science to research the quality of life in Cayce over the past nine years using Census, FBI, Zillow, and other primary data sources. Based on the most recently available data, we found the following about life in Cayce:
The population in Cayce is 13,755.
The median home value in Cayce is $195,496.
The median income in Cayce is $56,976.
The cost of living in Cayce is 92 which is 0.9x lower than the national average.
The median rent in Cayce is $1,246.
The unemployment rate in Cayce is 5.4%.
The poverty rate in Cayce is 17.9%.
The average high in Cayce is 75.5° and the average low is 52.2°.
Cayce SnackAbility
Overall SnackAbility
Cayce, SC Crime Report
Crime in Cayce summary. We use data from the FBI to determine the crime rates in Cayce. Key points include:
There were 687 total crimes in Cayce in the last reporting year.
The overall crime rate per 100,000 people in Cayce is 5,010.9 / 100k people.
The violent crime rate per 100,000 people in Cayce is 1,006.6 / 100k people.
The property crime rate per 100,000 people in Cayce is 4,004.4 / 100k people.
Overall, crime in Cayce is 115.60% above the national average.
Total Crimes
Above National Average
Crime In Cayce Comparison Table
| Statistic | Count Raw |
Cayce / 100k People |
South Carolina / 100k People |
National / 100k People |
|---|---|---|---|---|
| Total Crimes Per 100K | 687 | 5,010.9 | 3,251.8 | 2,324.2 |
| Violent Crime | 138 | 1,006.6 | 530.7 | 369.8 |
| Murder | 3 | 21.9 | 10.5 | 6.3 |
| Robbery | 6 | 43.8 | 59.8 | 66.1 |
| Aggravated Assault | 125 | 911.7 | 420.3 | 268.2 |
| Property Crime | 549 | 4,004.4 | 2,721.1 | 1,954.4 |
| Burglary | 87 | 634.6 | 448.0 | 269.8 |
| Larceny | 399 | 2,910.3 | 1,991.0 | 1,401.9 |
| Car Theft | 63 | 459.5 | 282.1 | 282.7 |
Cayce, SC Cost Of Living
Cost of living in Cayce summary. We use data on the cost of living to determine how expensive it is to live in Cayce. Real estate prices drive most of the variance in cost of living around South Carolina. Key points include:
The cost of living in Cayce is 92 with 100 being average.
The cost of living in Cayce is 0.9x lower than the national average.
The median home value in Cayce is $195,496.
The median income in Cayce is $56,976.
Cayce's Overall Cost Of Living
Lower Than The National Average
Cost Of Living In Cayce Comparison Table
| Living Expense | Cayce | South Carolina | National Average | |
|---|---|---|---|---|
| Overall | 92 | 96 | 100 | |
| Services | 104 | 99 | 100 | |
| Groceries | 102 | 100 | 100 | |
| Health | 85 | 96 | 100 | |
| Housing | 75 | 89 | 100 | |
| Transportation | 76 | 90 | 100 | |
| Utilities | 136 | 107 | 100 | |
Cayce, SC Weather
The average high in Cayce is 75.5° and the average low is 52.2°.
There are 70.9 days of precipitation each year.
Expect an average of 44.7 inches of precipitation each year with 1.0 inches of snow.
| Stat | Cayce |
|---|---|
| Average Annual High | 75.5 |
| Average Annual Low | 52.2 |
| Annual Precipitation Days | 70.9 |
| Average Annual Precipitation | 44.7 |
| Average Annual Snowfall | 1.0 |
Average High
Days of Rain
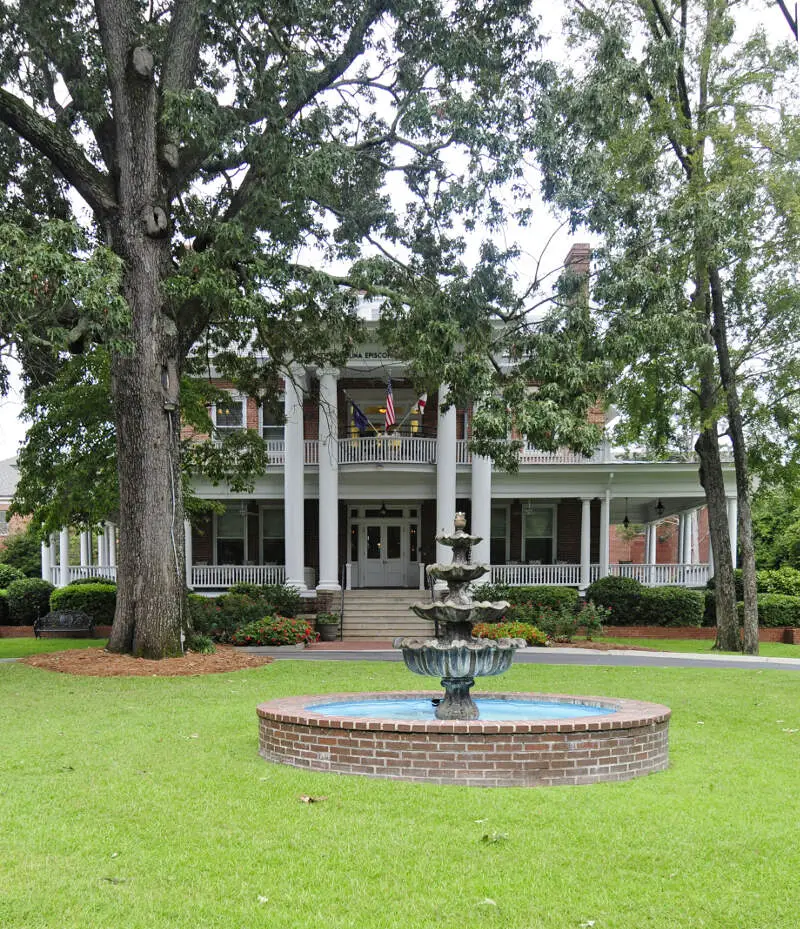
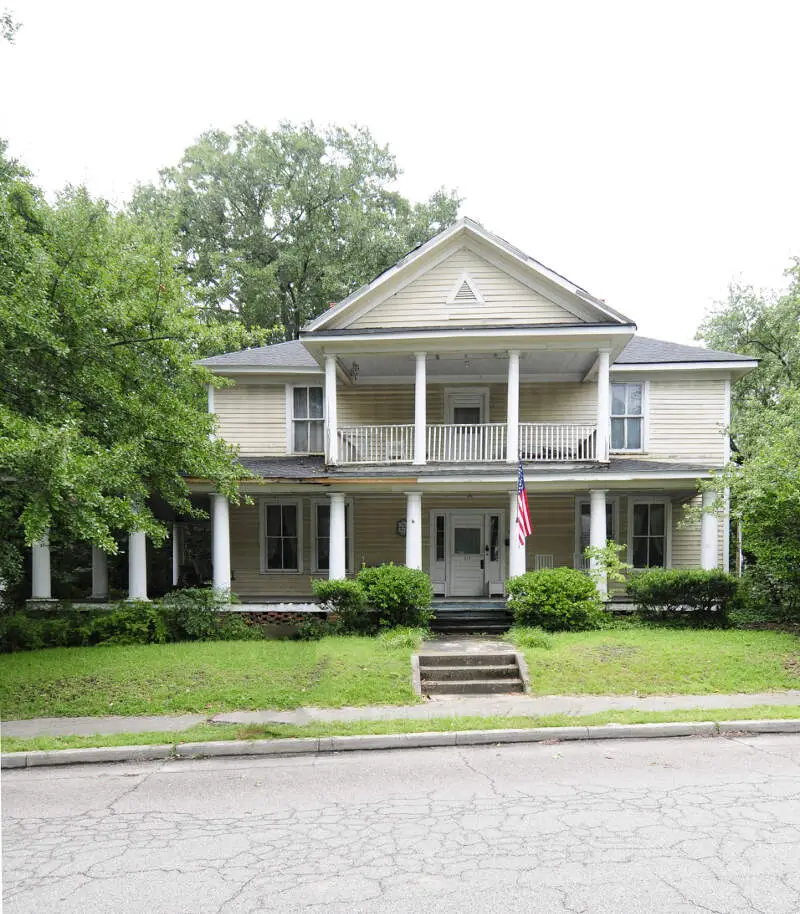
Cayce, SC Photos

Rankings for Cayce in South Carolina


Locations Around Cayce
Map Of Cayce, SC
Best Places Around Cayce
Lexington, SC
Population 23,665
Oak Grove, SC
Population 11,385
Seven Oaks, SC
Population 15,826
Irmo, SC
Population 11,685
Red Bank, SC
Population 10,544
Forest Acres, SC
Population 10,514
West Columbia, SC
Population 17,459
Woodfield, SC
Population 9,466
Dentsville, SC
Population 16,399
St. Andrews, SC
Population 21,909
Cayce Demographics And Statistics
Population over time in Cayce
The current population in Cayce is 13,755. The population has increased 11.7% from 2010.
| Year | Population | % Change |
|---|---|---|
| 2022 | 13,755 | 1.0% |
| 2021 | 13,621 | -0.3% |
| 2020 | 13,668 | -0.1% |
| 2019 | 13,684 | 1.0% |
| 2018 | 13,554 | 4.7% |
| 2017 | 12,944 | 1.6% |
| 2016 | 12,744 | 1.3% |
| 2015 | 12,584 | 1.3% |
| 2014 | 12,417 | 0.8% |
| 2013 | 12,319 | - |
Race / Ethnicity in Cayce
Cayce is:
60.5% White with 8,324 White residents.
24.7% African American with 3,398 African American residents.
0.0% American Indian with 0 American Indian residents.
4.1% Asian with 566 Asian residents.
0.0% Hawaiian with 0 Hawaiian residents.
0.1% Other with 20 Other residents.
3.2% Two Or More with 443 Two Or More residents.
7.3% Hispanic with 1,004 Hispanic residents.
| Race | Cayce | SC | USA |
|---|---|---|---|
| White | 60.5% | 63.0% | 58.9% |
| African American | 24.7% | 25.6% | 12.1% |
| American Indian | 0.0% | 0.2% | 0.6% |
| Asian | 4.1% | 1.7% | 5.7% |
| Hawaiian | 0.0% | 0.0% | 0.2% |
| Other | 0.1% | 0.4% | 0.4% |
| Two Or More | 3.2% | 2.9% | 3.5% |
| Hispanic | 7.3% | 6.2% | 18.7% |
Gender in Cayce
Cayce is 49.6% female with 6,817 female residents.
Cayce is 50.4% male with 6,938 male residents.
| Gender | Cayce | SC | USA |
|---|---|---|---|
| Female | 49.6% | 51.2% | 50.4% |
| Male | 50.4% | 48.8% | 49.6% |
Highest level of educational attainment in Cayce for adults over 25
1.0% of adults in Cayce completed < 9th grade.
3.0% of adults in Cayce completed 9-12th grade.
29.0% of adults in Cayce completed high school / ged.
24.0% of adults in Cayce completed some college.
10.0% of adults in Cayce completed associate's degree.
19.0% of adults in Cayce completed bachelor's degree.
11.0% of adults in Cayce completed master's degree.
1.0% of adults in Cayce completed professional degree.
2.0% of adults in Cayce completed doctorate degree.
| Education | Cayce | SC | USA |
|---|---|---|---|
| < 9th Grade | 1.0% | 4.0% | 4.0% |
| 9-12th Grade | 3.0% | 7.0% | 6.0% |
| High School / GED | 29.0% | 28.0% | 26.0% |
| Some College | 24.0% | 20.0% | 20.0% |
| Associate's Degree | 10.0% | 10.0% | 9.0% |
| Bachelor's Degree | 19.0% | 19.0% | 21.0% |
| Master's Degree | 11.0% | 9.0% | 10.0% |
| Professional Degree | 1.0% | 2.0% | 2.0% |
| Doctorate Degree | 2.0% | 1.0% | 2.0% |
Household Income For Cayce, South Carolina
6.5% of households in Cayce earn Less than $10,000.
1.8% of households in Cayce earn $10,000 to $14,999.
11.4% of households in Cayce earn $15,000 to $24,999.
9.1% of households in Cayce earn $25,000 to $34,999.
15.5% of households in Cayce earn $35,000 to $49,999.
16.0% of households in Cayce earn $50,000 to $74,999.
17.2% of households in Cayce earn $75,000 to $99,999.
14.9% of households in Cayce earn $100,000 to $149,999.
4.4% of households in Cayce earn $150,000 to $199,999.
3.1% of households in Cayce earn $200,000 or more.
| Income | Cayce | SC | USA |
|---|---|---|---|
| Less than $10,000 | 6.5% | 6.1% | 4.9% |
| $10,000 to $14,999 | 1.8% | 4.2% | 3.8% |
| $15,000 to $24,999 | 11.4% | 8.4% | 7.0% |
| $25,000 to $34,999 | 9.1% | 8.7% | 7.4% |
| $35,000 to $49,999 | 15.5% | 12.4% | 10.7% |
| $50,000 to $74,999 | 16.0% | 17.5% | 16.1% |
| $75,000 to $99,999 | 17.2% | 12.9% | 12.8% |
| $100,000 to $149,999 | 14.9% | 15.4% | 17.1% |
| $150,000 to $199,999 | 4.4% | 6.9% | 8.8% |
| $200,000 or more | 3.1% | 7.4% | 11.4% |


