Brownsville, TN
Demographics And Statistics
Living In Brownsville, Tennessee Summary
Life in Brownsville research summary. HomeSnacks has been using Saturday Night Science to research the quality of life in Brownsville over the past nine years using Census, FBI, Zillow, and other primary data sources. Based on the most recently available data, we found the following about life in Brownsville:
The population in Brownsville is 9,739.
The median home value in Brownsville is $151,683.
The median income in Brownsville is $38,662.
The cost of living in Brownsville is 81 which is 0.8x lower than the national average.
The median rent in Brownsville is $706.
The unemployment rate in Brownsville is 11.5%.
The poverty rate in Brownsville is 28.0%.
The average high in Brownsville is 70.3° and the average low is 49.7°.
Brownsville SnackAbility
Overall SnackAbility
Brownsville, TN Crime Report
Crime in Brownsville summary. We use data from the FBI to determine the crime rates in Brownsville. Key points include:
There were 348 total crimes in Brownsville in the last reporting year.
The overall crime rate per 100,000 people in Brownsville is 3,633.3 / 100k people.
The violent crime rate per 100,000 people in Brownsville is 1,252.9 / 100k people.
The property crime rate per 100,000 people in Brownsville is 2,380.5 / 100k people.
Overall, crime in Brownsville is 56.33% above the national average.
Total Crimes
Above National Average
Crime In Brownsville Comparison Table
| Statistic | Count Raw |
Brownsville / 100k People |
Tennessee / 100k People |
National / 100k People |
|---|---|---|---|---|
| Total Crimes Per 100K | 348 | 3,633.3 | 3,165.5 | 2,324.2 |
| Violent Crime | 120 | 1,252.9 | 672.7 | 369.8 |
| Murder | 2 | 20.9 | 9.6 | 6.3 |
| Robbery | 5 | 52.2 | 81.0 | 66.1 |
| Aggravated Assault | 109 | 1,138.0 | 543.2 | 268.2 |
| Property Crime | 228 | 2,380.5 | 2,492.8 | 1,954.4 |
| Burglary | 45 | 469.8 | 384.5 | 269.8 |
| Larceny | 159 | 1,660.1 | 1,802.0 | 1,401.9 |
| Car Theft | 24 | 250.6 | 306.4 | 282.7 |
Brownsville, TN Cost Of Living
Cost of living in Brownsville summary. We use data on the cost of living to determine how expensive it is to live in Brownsville. Real estate prices drive most of the variance in cost of living around Tennessee. Key points include:
The cost of living in Brownsville is 81 with 100 being average.
The cost of living in Brownsville is 0.8x lower than the national average.
The median home value in Brownsville is $151,683.
The median income in Brownsville is $38,662.
Brownsville's Overall Cost Of Living
Lower Than The National Average
Cost Of Living In Brownsville Comparison Table
| Living Expense | Brownsville | Tennessee | National Average | |
|---|---|---|---|---|
| Overall | 81 | 90 | 100 | |
| Services | 93 | 93 | 100 | |
| Groceries | 94 | 96 | 100 | |
| Health | 89 | 88 | 100 | |
| Housing | 56 | 82 | 100 | |
| Transportation | 90 | 90 | 100 | |
| Utilities | 97 | 93 | 100 | |
Brownsville, TN Weather
The average high in Brownsville is 70.3° and the average low is 49.7°.
There are 75.7 days of precipitation each year.
Expect an average of 52.8 inches of precipitation each year with 3.7 inches of snow.
| Stat | Brownsville |
|---|---|
| Average Annual High | 70.3 |
| Average Annual Low | 49.7 |
| Annual Precipitation Days | 75.7 |
| Average Annual Precipitation | 52.8 |
| Average Annual Snowfall | 3.7 |
Average High
Days of Rain
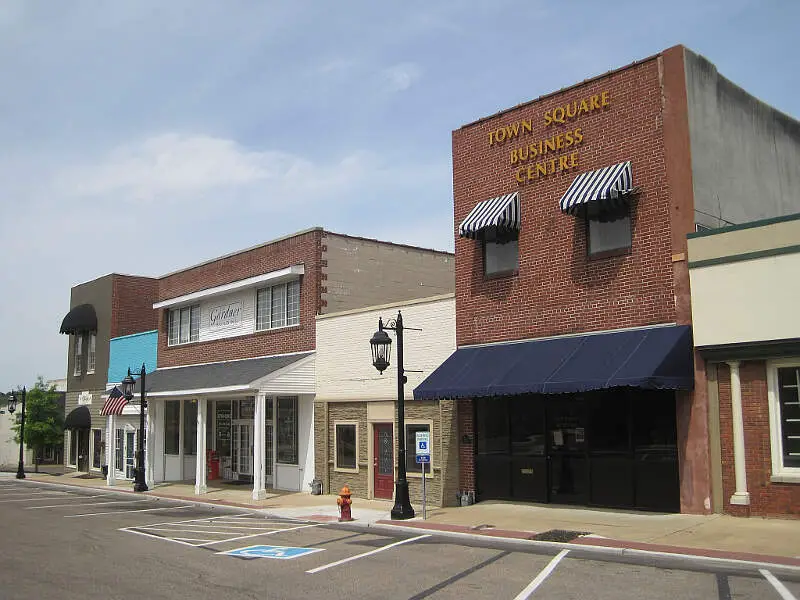
Brownsville, TN Photos

2 Reviews & Comments About Brownsville
/5

Michael Boyd -
I'm from Brownsville. The changes are minimal since I left....in 1990. Truth be told, it's the South. Most of what is said about these cities can be said about many cities here.
Rudy Flores -
S**t i live in Brownsville its ok crime is not so bad just stay away from next door. We have the island
Rankings for Brownsville in Tennessee


Locations Around Brownsville
Map Of Brownsville, TN
Best Places Around Brownsville
Germantown, TN
Population 41,094
Collierville, TN
Population 51,170
Arlington, TN
Population 14,342
Bartlett, TN
Population 57,481
Oakland, TN
Population 9,139
Atoka, TN
Population 10,070
Munford, TN
Population 6,357
Millington, TN
Population 10,558
Jackson, TN
Population 67,993
Lexington, TN
Population 7,927
Brownsville Demographics And Statistics
Population over time in Brownsville
The current population in Brownsville is 9,739. The population has decreased -6.3% from 2010.
| Year | Population | % Change |
|---|---|---|
| 2022 | 9,739 | 0.2% |
| 2021 | 9,715 | -1.2% |
| 2020 | 9,829 | -1.1% |
| 2019 | 9,938 | -0.8% |
| 2018 | 10,016 | -0.6% |
| 2017 | 10,079 | -0.8% |
| 2016 | 10,165 | -0.6% |
| 2015 | 10,223 | -1.0% |
| 2014 | 10,322 | -0.7% |
| 2013 | 10,392 | - |
Race / Ethnicity in Brownsville
Brownsville is:
25.6% White with 2,493 White residents.
68.0% African American with 6,619 African American residents.
0.0% American Indian with 0 American Indian residents.
0.0% Asian with 0 Asian residents.
0.0% Hawaiian with 0 Hawaiian residents.
0.7% Other with 71 Other residents.
1.3% Two Or More with 129 Two Or More residents.
4.4% Hispanic with 427 Hispanic residents.
| Race | Brownsville | TN | USA |
|---|---|---|---|
| White | 25.6% | 72.6% | 58.9% |
| African American | 68.0% | 16.1% | 12.1% |
| American Indian | 0.0% | 0.1% | 0.6% |
| Asian | 0.0% | 1.8% | 5.7% |
| Hawaiian | 0.0% | 0.0% | 0.2% |
| Other | 0.7% | 0.3% | 0.4% |
| Two Or More | 1.3% | 3.0% | 3.5% |
| Hispanic | 4.4% | 6.0% | 18.7% |
Gender in Brownsville
Brownsville is 53.7% female with 5,233 female residents.
Brownsville is 46.3% male with 4,506 male residents.
| Gender | Brownsville | TN | USA |
|---|---|---|---|
| Female | 53.7% | 50.9% | 50.4% |
| Male | 46.3% | 49.1% | 49.6% |
Highest level of educational attainment in Brownsville for adults over 25
6.0% of adults in Brownsville completed < 9th grade.
13.0% of adults in Brownsville completed 9-12th grade.
48.0% of adults in Brownsville completed high school / ged.
19.0% of adults in Brownsville completed some college.
5.0% of adults in Brownsville completed associate's degree.
6.0% of adults in Brownsville completed bachelor's degree.
3.0% of adults in Brownsville completed master's degree.
0.0% of adults in Brownsville completed professional degree.
0.0% of adults in Brownsville completed doctorate degree.
| Education | Brownsville | TN | USA |
|---|---|---|---|
| < 9th Grade | 6.0% | 4.0% | 4.0% |
| 9-12th Grade | 13.0% | 7.0% | 6.0% |
| High School / GED | 48.0% | 31.0% | 26.0% |
| Some College | 19.0% | 20.0% | 20.0% |
| Associate's Degree | 5.0% | 8.0% | 9.0% |
| Bachelor's Degree | 6.0% | 19.0% | 21.0% |
| Master's Degree | 3.0% | 8.0% | 10.0% |
| Professional Degree | 0.0% | 2.0% | 2.0% |
| Doctorate Degree | 0.0% | 1.0% | 2.0% |
Household Income For Brownsville, Tennessee
10.4% of households in Brownsville earn Less than $10,000.
13.4% of households in Brownsville earn $10,000 to $14,999.
12.8% of households in Brownsville earn $15,000 to $24,999.
9.2% of households in Brownsville earn $25,000 to $34,999.
14.3% of households in Brownsville earn $35,000 to $49,999.
16.4% of households in Brownsville earn $50,000 to $74,999.
11.7% of households in Brownsville earn $75,000 to $99,999.
7.5% of households in Brownsville earn $100,000 to $149,999.
1.9% of households in Brownsville earn $150,000 to $199,999.
2.3% of households in Brownsville earn $200,000 or more.
| Income | Brownsville | TN | USA |
|---|---|---|---|
| Less than $10,000 | 10.4% | 5.3% | 4.9% |
| $10,000 to $14,999 | 13.4% | 4.5% | 3.8% |
| $15,000 to $24,999 | 12.8% | 8.4% | 7.0% |
| $25,000 to $34,999 | 9.2% | 8.5% | 7.4% |
| $35,000 to $49,999 | 14.3% | 12.8% | 10.7% |
| $50,000 to $74,999 | 16.4% | 17.6% | 16.1% |
| $75,000 to $99,999 | 11.7% | 13.2% | 12.8% |
| $100,000 to $149,999 | 7.5% | 15.7% | 17.1% |
| $150,000 to $199,999 | 1.9% | 6.7% | 8.8% |
| $200,000 or more | 2.3% | 7.3% | 11.4% |


