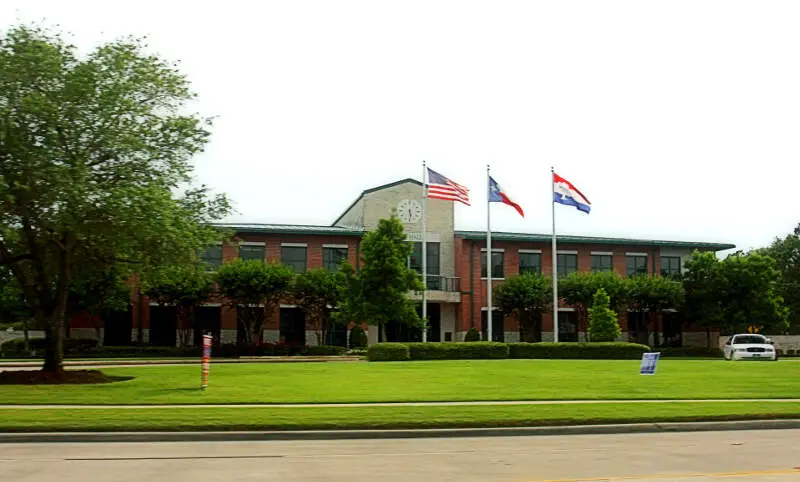
Friendswood, TX
Demographics And Statistics
Living In Friendswood, Texas Summary
Life in Friendswood research summary. HomeSnacks has been using Saturday Night Science to research the quality of life in Friendswood over the past nine years using Census, FBI, Zillow, and other primary data sources. Based on the most recently available data, we found the following about life in Friendswood:
The population in Friendswood is 40,888.
The median home value in Friendswood is $435,930.
The median income in Friendswood is $121,301.
The cost of living in Friendswood is 105 which is 1.1x higher than the national average.
The median rent in Friendswood is $1,636.
The unemployment rate in Friendswood is 4.6%.
The poverty rate in Friendswood is 2.9%.
The average high in Friendswood is 78.6° and the average low is 60.7°.
Friendswood SnackAbility
Overall SnackAbility
Friendswood, TX Crime Report
Crime in Friendswood summary. We use data from the FBI to determine the crime rates in Friendswood. Key points include:
There were 267 total crimes in Friendswood in the last reporting year.
The overall crime rate per 100,000 people in Friendswood is 653.6 / 100k people.
The violent crime rate per 100,000 people in Friendswood is 83.2 / 100k people.
The property crime rate per 100,000 people in Friendswood is 570.4 / 100k people.
Overall, crime in Friendswood is -71.88% below the national average.
Total Crimes
Below National Average
Crime In Friendswood Comparison Table
| Statistic | Count Raw |
Friendswood / 100k People |
Texas / 100k People |
National / 100k People |
|---|---|---|---|---|
| Total Crimes Per 100K | 267 | 653.6 | 2,691.5 | 2,324.2 |
| Violent Crime | 34 | 83.2 | 446.5 | 369.8 |
| Murder | 1 | 2.4 | 6.6 | 6.3 |
| Robbery | 6 | 14.7 | 91.4 | 66.1 |
| Aggravated Assault | 12 | 29.4 | 302.5 | 268.2 |
| Property Crime | 233 | 570.4 | 2,245.0 | 1,954.4 |
| Burglary | 33 | 80.8 | 370.7 | 269.8 |
| Larceny | 174 | 425.9 | 1,587.3 | 1,401.9 |
| Car Theft | 26 | 63.6 | 287.0 | 282.7 |
Friendswood, TX Cost Of Living
Cost of living in Friendswood summary. We use data on the cost of living to determine how expensive it is to live in Friendswood. Real estate prices drive most of the variance in cost of living around Texas. Key points include:
The cost of living in Friendswood is 105 with 100 being average.
The cost of living in Friendswood is 1.1x higher than the national average.
The median home value in Friendswood is $435,930.
The median income in Friendswood is $121,301.
Friendswood's Overall Cost Of Living
Higher Than The National Average
Cost Of Living In Friendswood Comparison Table
| Living Expense | Friendswood | Texas | National Average | |
|---|---|---|---|---|
| Overall | 105 | 92 | 100 | |
| Services | 98 | 96 | 100 | |
| Groceries | 92 | 93 | 100 | |
| Health | 94 | 93 | 100 | |
| Housing | 127 | 84 | 100 | |
| Transportation | 93 | 92 | 100 | |
| Utilities | 101 | 104 | 100 | |
Friendswood, TX Weather
The average high in Friendswood is 78.6° and the average low is 60.7°.
There are 69.0 days of precipitation each year.
Expect an average of 55.2 inches of precipitation each year with 0.1 inches of snow.
| Stat | Friendswood |
|---|---|
| Average Annual High | 78.6 |
| Average Annual Low | 60.7 |
| Annual Precipitation Days | 69.0 |
| Average Annual Precipitation | 55.2 |
| Average Annual Snowfall | 0.1 |
Average High
Days of Rain
Friendswood, TX Photos
1 Reviews & Comments About Friendswood
/5

Eric Boosa -
I lived in Friendswood for a bit and traffic in and around houston really s***s. I am in killeen now and surprised that killeen is not on the list. probably make the 20 worst
Rankings for Friendswood in Texas


Locations Around Friendswood
Map Of Friendswood, TX
Best Places Around Friendswood
West University Place, TX
Population 14,963
Deer Park, TX
Population 34,046
Fresno, TX
Population 23,608
Pearland, TX
Population 124,478
Galena Park, TX
Population 10,641
La Porte, TX
Population 35,782
Cloverleaf, TX
Population 24,735
Seabrook, TX
Population 13,558
Dickinson, TX
Population 21,475
Friendswood Demographics And Statistics
Population over time in Friendswood
The current population in Friendswood is 40,888. The population has increased 17.6% from 2010.
| Year | Population | % Change |
|---|---|---|
| 2022 | 40,888 | 4.0% |
| 2021 | 39,319 | 1.3% |
| 2020 | 38,811 | 1.4% |
| 2019 | 38,272 | 1.8% |
| 2018 | 37,602 | 1.6% |
| 2017 | 37,001 | 1.7% |
| 2016 | 36,375 | 1.5% |
| 2015 | 35,853 | 1.4% |
| 2014 | 35,358 | 1.7% |
| 2013 | 34,772 | - |
Race / Ethnicity in Friendswood
Friendswood is:
70.7% White with 28,922 White residents.
4.2% African American with 1,726 African American residents.
0.0% American Indian with 7 American Indian residents.
4.8% Asian with 1,971 Asian residents.
0.0% Hawaiian with 0 Hawaiian residents.
0.5% Other with 184 Other residents.
3.0% Two Or More with 1,220 Two Or More residents.
16.8% Hispanic with 6,858 Hispanic residents.
| Race | Friendswood | TX | USA |
|---|---|---|---|
| White | 70.7% | 40.1% | 58.9% |
| African American | 4.2% | 11.8% | 12.1% |
| American Indian | 0.0% | 0.2% | 0.6% |
| Asian | 4.8% | 5.1% | 5.7% |
| Hawaiian | 0.0% | 0.1% | 0.2% |
| Other | 0.5% | 0.3% | 0.4% |
| Two Or More | 3.0% | 2.6% | 3.5% |
| Hispanic | 16.8% | 39.9% | 18.7% |
Gender in Friendswood
Friendswood is 51.9% female with 21,206 female residents.
Friendswood is 48.1% male with 19,682 male residents.
| Gender | Friendswood | TX | USA |
|---|---|---|---|
| Female | 51.9% | 50.0% | 50.4% |
| Male | 48.1% | 50.0% | 49.6% |
Highest level of educational attainment in Friendswood for adults over 25
3.0% of adults in Friendswood completed < 9th grade.
2.0% of adults in Friendswood completed 9-12th grade.
16.0% of adults in Friendswood completed high school / ged.
22.0% of adults in Friendswood completed some college.
9.0% of adults in Friendswood completed associate's degree.
31.0% of adults in Friendswood completed bachelor's degree.
12.0% of adults in Friendswood completed master's degree.
3.0% of adults in Friendswood completed professional degree.
2.0% of adults in Friendswood completed doctorate degree.
| Education | Friendswood | TX | USA |
|---|---|---|---|
| < 9th Grade | 3.0% | 8.0% | 4.0% |
| 9-12th Grade | 2.0% | 7.0% | 6.0% |
| High School / GED | 16.0% | 24.0% | 26.0% |
| Some College | 22.0% | 21.0% | 20.0% |
| Associate's Degree | 9.0% | 8.0% | 9.0% |
| Bachelor's Degree | 31.0% | 21.0% | 21.0% |
| Master's Degree | 12.0% | 8.0% | 10.0% |
| Professional Degree | 3.0% | 2.0% | 2.0% |
| Doctorate Degree | 2.0% | 1.0% | 2.0% |
Household Income For Friendswood, Texas
1.7% of households in Friendswood earn Less than $10,000.
1.3% of households in Friendswood earn $10,000 to $14,999.
3.4% of households in Friendswood earn $15,000 to $24,999.
5.0% of households in Friendswood earn $25,000 to $34,999.
6.0% of households in Friendswood earn $35,000 to $49,999.
11.0% of households in Friendswood earn $50,000 to $74,999.
12.5% of households in Friendswood earn $75,000 to $99,999.
19.8% of households in Friendswood earn $100,000 to $149,999.
13.8% of households in Friendswood earn $150,000 to $199,999.
25.5% of households in Friendswood earn $200,000 or more.
| Income | Friendswood | TX | USA |
|---|---|---|---|
| Less than $10,000 | 1.7% | 5.1% | 4.9% |
| $10,000 to $14,999 | 1.3% | 3.6% | 3.8% |
| $15,000 to $24,999 | 3.4% | 7.0% | 7.0% |
| $25,000 to $34,999 | 5.0% | 7.7% | 7.4% |
| $35,000 to $49,999 | 6.0% | 11.1% | 10.7% |
| $50,000 to $74,999 | 11.0% | 16.7% | 16.1% |
| $75,000 to $99,999 | 12.5% | 12.7% | 12.8% |
| $100,000 to $149,999 | 19.8% | 16.9% | 17.1% |
| $150,000 to $199,999 | 13.8% | 8.7% | 8.8% |
| $200,000 or more | 25.5% | 10.6% | 11.4% |


