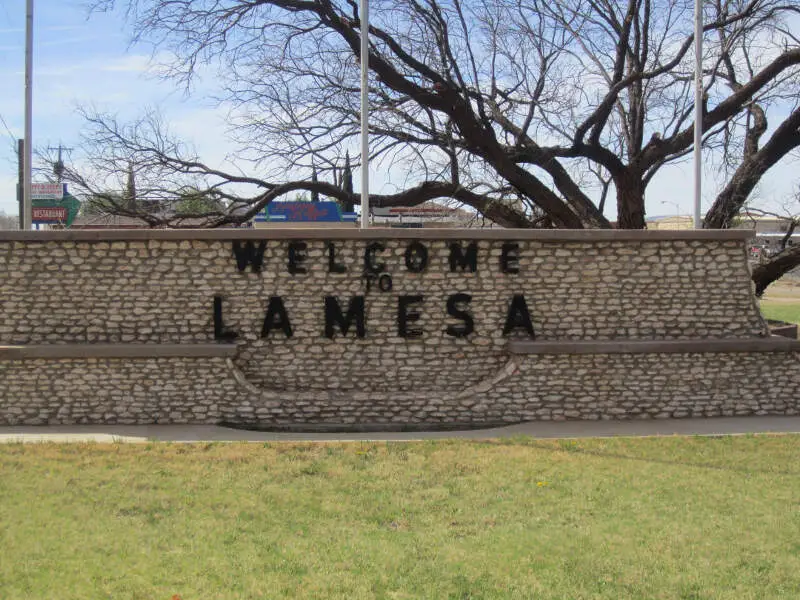
Lamesa, TX
Demographics And Statistics
Living In Lamesa, Texas Summary
Life in Lamesa research summary. HomeSnacks has been using Saturday Night Science to research the quality of life in Lamesa over the past nine years using Census, FBI, Zillow, and other primary data sources. Based on the most recently available data, we found the following about life in Lamesa:
The population in Lamesa is 8,571.
The median home value in Lamesa is $80,354.
The median income in Lamesa is $39,434.
The cost of living in Lamesa is 79 which is 0.8x lower than the national average.
The median rent in Lamesa is $817.
The unemployment rate in Lamesa is 11.0%.
The poverty rate in Lamesa is 28.4%.
The average high in Lamesa is 75.8° and the average low is 47.9°.
Lamesa SnackAbility
Overall SnackAbility
Lamesa, TX Crime Report
Crime in Lamesa summary. We use data from the FBI to determine the crime rates in Lamesa. Key points include:
There were 254 total crimes in Lamesa in the last reporting year.
The overall crime rate per 100,000 people in Lamesa is 2,910.8 / 100k people.
The violent crime rate per 100,000 people in Lamesa is 492.8 / 100k people.
The property crime rate per 100,000 people in Lamesa is 2,418.1 / 100k people.
Overall, crime in Lamesa is 25.24% above the national average.
Total Crimes
Above National Average
Crime In Lamesa Comparison Table
| Statistic | Count Raw |
Lamesa / 100k People |
Texas / 100k People |
National / 100k People |
|---|---|---|---|---|
| Total Crimes Per 100K | 254 | 2,910.8 | 2,691.5 | 2,324.2 |
| Violent Crime | 43 | 492.8 | 446.5 | 369.8 |
| Murder | 1 | 11.5 | 6.6 | 6.3 |
| Robbery | 2 | 22.9 | 91.4 | 66.1 |
| Aggravated Assault | 34 | 389.6 | 302.5 | 268.2 |
| Property Crime | 211 | 2,418.1 | 2,245.0 | 1,954.4 |
| Burglary | 44 | 504.2 | 370.7 | 269.8 |
| Larceny | 150 | 1,719.0 | 1,587.3 | 1,401.9 |
| Car Theft | 17 | 194.8 | 287.0 | 282.7 |
Lamesa, TX Cost Of Living
Cost of living in Lamesa summary. We use data on the cost of living to determine how expensive it is to live in Lamesa. Real estate prices drive most of the variance in cost of living around Texas. Key points include:
The cost of living in Lamesa is 79 with 100 being average.
The cost of living in Lamesa is 0.8x lower than the national average.
The median home value in Lamesa is $80,354.
The median income in Lamesa is $39,434.
Lamesa's Overall Cost Of Living
Lower Than The National Average
Cost Of Living In Lamesa Comparison Table
| Living Expense | Lamesa | Texas | National Average | |
|---|---|---|---|---|
| Overall | 79 | 92 | 100 | |
| Services | 103 | 96 | 100 | |
| Groceries | 88 | 93 | 100 | |
| Health | 93 | 93 | 100 | |
| Housing | 41 | 84 | 100 | |
| Transportation | 94 | 92 | 100 | |
| Utilities | 96 | 104 | 100 | |
Lamesa, TX Weather
The average high in Lamesa is 75.8° and the average low is 47.9°.
There are 32.8 days of precipitation each year.
Expect an average of 18.9 inches of precipitation each year with 3.8 inches of snow.
| Stat | Lamesa |
|---|---|
| Average Annual High | 75.8 |
| Average Annual Low | 47.9 |
| Annual Precipitation Days | 32.8 |
| Average Annual Precipitation | 18.9 |
| Average Annual Snowfall | 3.8 |
Average High
Days of Rain
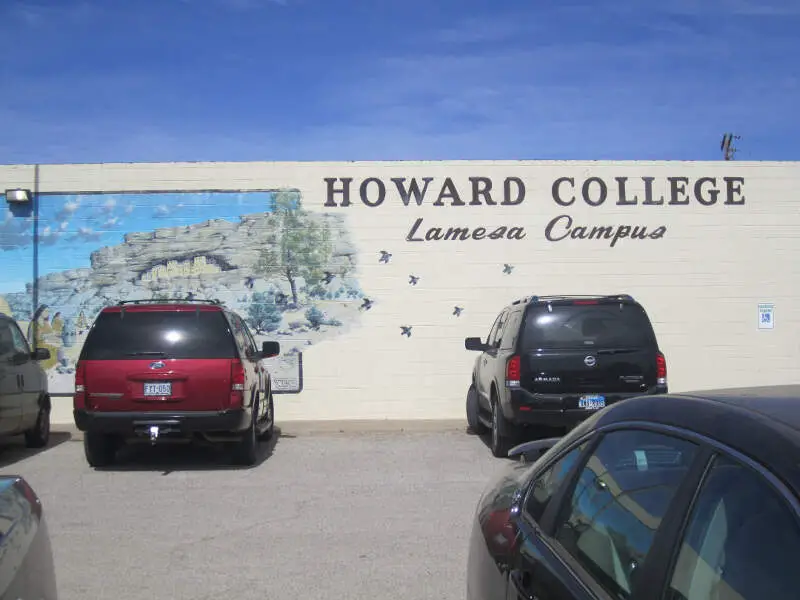
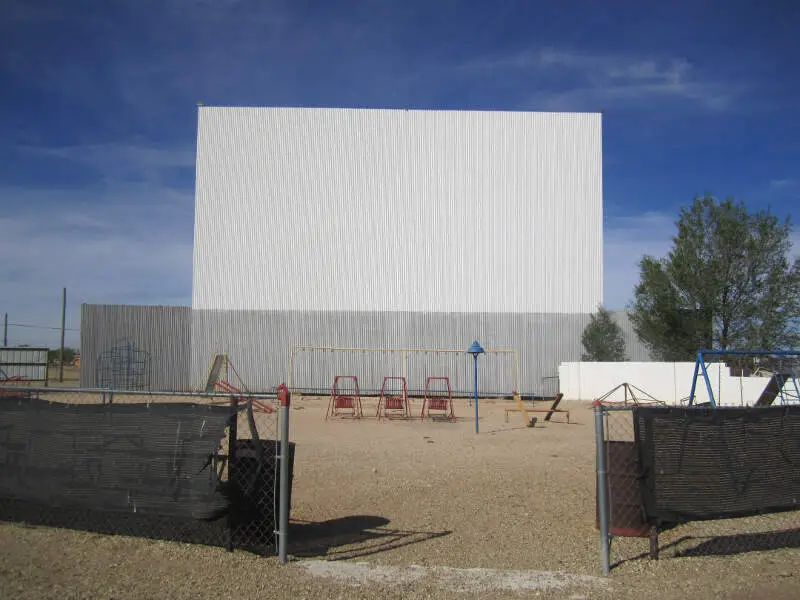
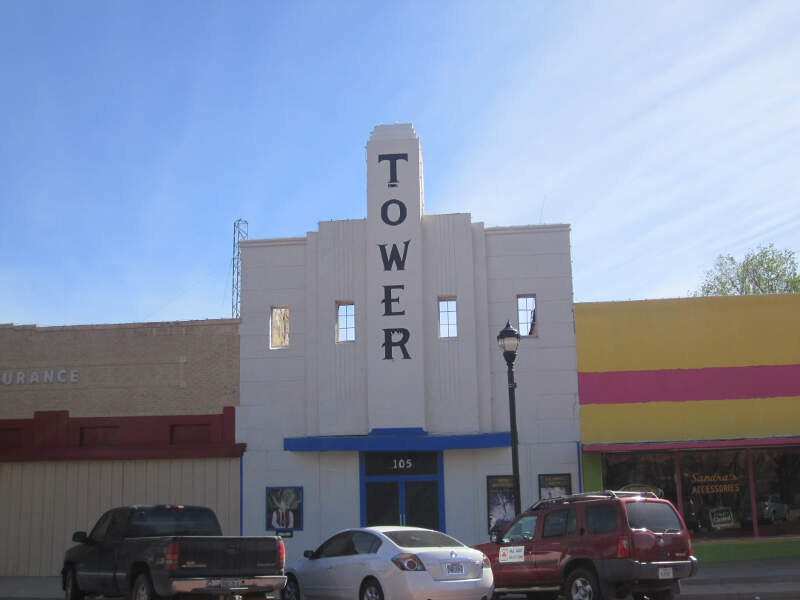
Lamesa, TX Photos


Rankings for Lamesa in Texas


Locations Around Lamesa
Map Of Lamesa, TX
Best Places Around Lamesa
Andrews, TX
Population 13,342
Midland, TX
Population 132,490
Big Spring, TX
Population 25,949
Lamesa Demographics And Statistics
Population over time in Lamesa
The current population in Lamesa is 8,571. The population has decreased -8.5% from 2010.
| Year | Population | % Change |
|---|---|---|
| 2022 | 8,571 | -7.5% |
| 2021 | 9,264 | -0.6% |
| 2020 | 9,322 | -0.5% |
| 2019 | 9,367 | 0.3% |
| 2018 | 9,343 | -0.2% |
| 2017 | 9,365 | 0.3% |
| 2016 | 9,337 | 0.2% |
| 2015 | 9,320 | -0.4% |
| 2014 | 9,362 | -0.1% |
| 2013 | 9,367 | - |
Race / Ethnicity in Lamesa
Lamesa is:
24.4% White with 2,088 White residents.
2.8% African American with 244 African American residents.
0.2% American Indian with 17 American Indian residents.
0.0% Asian with 0 Asian residents.
0.0% Hawaiian with 1 Hawaiian residents.
0.0% Other with 0 Other residents.
0.7% Two Or More with 60 Two Or More residents.
71.9% Hispanic with 6,161 Hispanic residents.
| Race | Lamesa | TX | USA |
|---|---|---|---|
| White | 24.4% | 40.1% | 58.9% |
| African American | 2.8% | 11.8% | 12.1% |
| American Indian | 0.2% | 0.2% | 0.6% |
| Asian | 0.0% | 5.1% | 5.7% |
| Hawaiian | 0.0% | 0.1% | 0.2% |
| Other | 0.0% | 0.3% | 0.4% |
| Two Or More | 0.7% | 2.6% | 3.5% |
| Hispanic | 71.9% | 39.9% | 18.7% |
Gender in Lamesa
Lamesa is 51.0% female with 4,368 female residents.
Lamesa is 49.0% male with 4,203 male residents.
| Gender | Lamesa | TX | USA |
|---|---|---|---|
| Female | 51.0% | 50.0% | 50.4% |
| Male | 49.0% | 50.0% | 49.6% |
Highest level of educational attainment in Lamesa for adults over 25
16.0% of adults in Lamesa completed < 9th grade.
12.0% of adults in Lamesa completed 9-12th grade.
37.0% of adults in Lamesa completed high school / ged.
16.0% of adults in Lamesa completed some college.
4.0% of adults in Lamesa completed associate's degree.
13.0% of adults in Lamesa completed bachelor's degree.
1.0% of adults in Lamesa completed master's degree.
1.0% of adults in Lamesa completed professional degree.
0.0% of adults in Lamesa completed doctorate degree.
| Education | Lamesa | TX | USA |
|---|---|---|---|
| < 9th Grade | 16.0% | 8.0% | 4.0% |
| 9-12th Grade | 12.0% | 7.0% | 6.0% |
| High School / GED | 37.0% | 24.0% | 26.0% |
| Some College | 16.0% | 21.0% | 20.0% |
| Associate's Degree | 4.0% | 8.0% | 9.0% |
| Bachelor's Degree | 13.0% | 21.0% | 21.0% |
| Master's Degree | 1.0% | 8.0% | 10.0% |
| Professional Degree | 1.0% | 2.0% | 2.0% |
| Doctorate Degree | 0.0% | 1.0% | 2.0% |
Household Income For Lamesa, Texas
6.0% of households in Lamesa earn Less than $10,000.
10.8% of households in Lamesa earn $10,000 to $14,999.
20.7% of households in Lamesa earn $15,000 to $24,999.
10.6% of households in Lamesa earn $25,000 to $34,999.
8.0% of households in Lamesa earn $35,000 to $49,999.
14.0% of households in Lamesa earn $50,000 to $74,999.
12.5% of households in Lamesa earn $75,000 to $99,999.
10.1% of households in Lamesa earn $100,000 to $149,999.
5.4% of households in Lamesa earn $150,000 to $199,999.
2.0% of households in Lamesa earn $200,000 or more.
| Income | Lamesa | TX | USA |
|---|---|---|---|
| Less than $10,000 | 6.0% | 5.1% | 4.9% |
| $10,000 to $14,999 | 10.8% | 3.6% | 3.8% |
| $15,000 to $24,999 | 20.7% | 7.0% | 7.0% |
| $25,000 to $34,999 | 10.6% | 7.7% | 7.4% |
| $35,000 to $49,999 | 8.0% | 11.1% | 10.7% |
| $50,000 to $74,999 | 14.0% | 16.7% | 16.1% |
| $75,000 to $99,999 | 12.5% | 12.7% | 12.8% |
| $100,000 to $149,999 | 10.1% | 16.9% | 17.1% |
| $150,000 to $199,999 | 5.4% | 8.7% | 8.8% |
| $200,000 or more | 2.0% | 10.6% | 11.4% |


