New Braunfels, TX
Demographics And Statistics
Living In New Braunfels, Texas Summary
Life in New Braunfels research summary. HomeSnacks has been using Saturday Night Science to research the quality of life in New Braunfels over the past nine years using Census, FBI, Zillow, and other primary data sources. Based on the most recently available data, we found the following about life in New Braunfels:
The population in New Braunfels is 92,993.
The median home value in New Braunfels is $374,671.
The median income in New Braunfels is $85,827.
The cost of living in New Braunfels is 98 which is 1.0x lower than the national average.
The median rent in New Braunfels is $1,426.
The unemployment rate in New Braunfels is 3.8%.
The poverty rate in New Braunfels is 6.0%.
The average high in New Braunfels is 79.8° and the average low is 57.0°.
New Braunfels SnackAbility
Overall SnackAbility
New Braunfels, TX Crime Report
Crime in New Braunfels summary. We use data from the FBI to determine the crime rates in New Braunfels. Key points include:
There were 1,714 total crimes in New Braunfels in the last reporting year.
The overall crime rate per 100,000 people in New Braunfels is 1,601.6 / 100k people.
The violent crime rate per 100,000 people in New Braunfels is 187.8 / 100k people.
The property crime rate per 100,000 people in New Braunfels is 1,413.8 / 100k people.
Overall, crime in New Braunfels is -31.09% below the national average.
Total Crimes
Below National Average
Crime In New Braunfels Comparison Table
| Statistic | Count Raw |
New Braunfels / 100k People |
Texas / 100k People |
National / 100k People |
|---|---|---|---|---|
| Total Crimes Per 100K | 1,714 | 1,601.6 | 2,691.5 | 2,324.2 |
| Violent Crime | 201 | 187.8 | 446.5 | 369.8 |
| Murder | 0 | 0.0 | 6.6 | 6.3 |
| Robbery | 20 | 18.7 | 91.4 | 66.1 |
| Aggravated Assault | 151 | 141.1 | 302.5 | 268.2 |
| Property Crime | 1,513 | 1,413.8 | 2,245.0 | 1,954.4 |
| Burglary | 179 | 167.3 | 370.7 | 269.8 |
| Larceny | 1,157 | 1,081.1 | 1,587.3 | 1,401.9 |
| Car Theft | 177 | 165.4 | 287.0 | 282.7 |
New Braunfels, TX Cost Of Living
Cost of living in New Braunfels summary. We use data on the cost of living to determine how expensive it is to live in New Braunfels. Real estate prices drive most of the variance in cost of living around Texas. Key points include:
The cost of living in New Braunfels is 98 with 100 being average.
The cost of living in New Braunfels is 1.0x lower than the national average.
The median home value in New Braunfels is $374,671.
The median income in New Braunfels is $85,827.
New Braunfels's Overall Cost Of Living
Lower Than The National Average
Cost Of Living In New Braunfels Comparison Table
| Living Expense | New Braunfels | Texas | National Average | |
|---|---|---|---|---|
| Overall | 98 | 92 | 100 | |
| Services | 100 | 96 | 100 | |
| Groceries | 87 | 93 | 100 | |
| Health | 101 | 93 | 100 | |
| Housing | 98 | 84 | 100 | |
| Transportation | 105 | 92 | 100 | |
| Utilities | 95 | 104 | 100 | |
New Braunfels, TX Weather
The average high in New Braunfels is 79.8° and the average low is 57.0°.
There are 48.0 days of precipitation each year.
Expect an average of 34.7 inches of precipitation each year with 0.3 inches of snow.
| Stat | New Braunfels |
|---|---|
| Average Annual High | 79.8 |
| Average Annual Low | 57.0 |
| Annual Precipitation Days | 48.0 |
| Average Annual Precipitation | 34.7 |
| Average Annual Snowfall | 0.3 |
Average High
Days of Rain
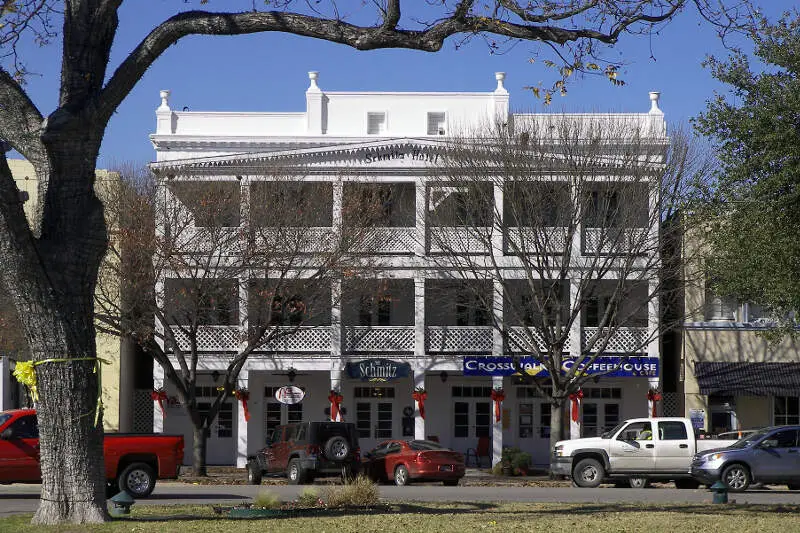
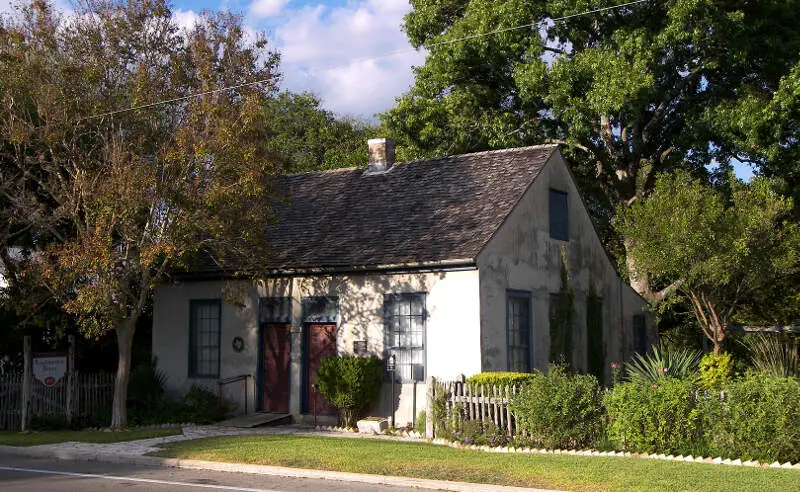
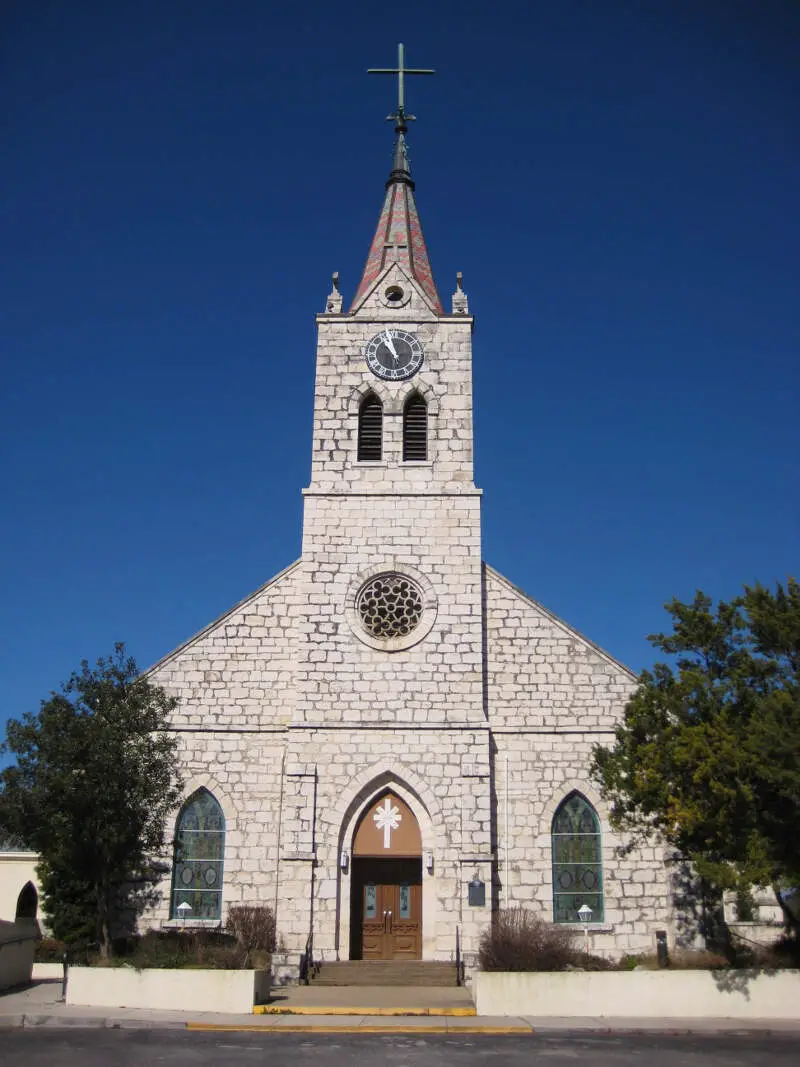
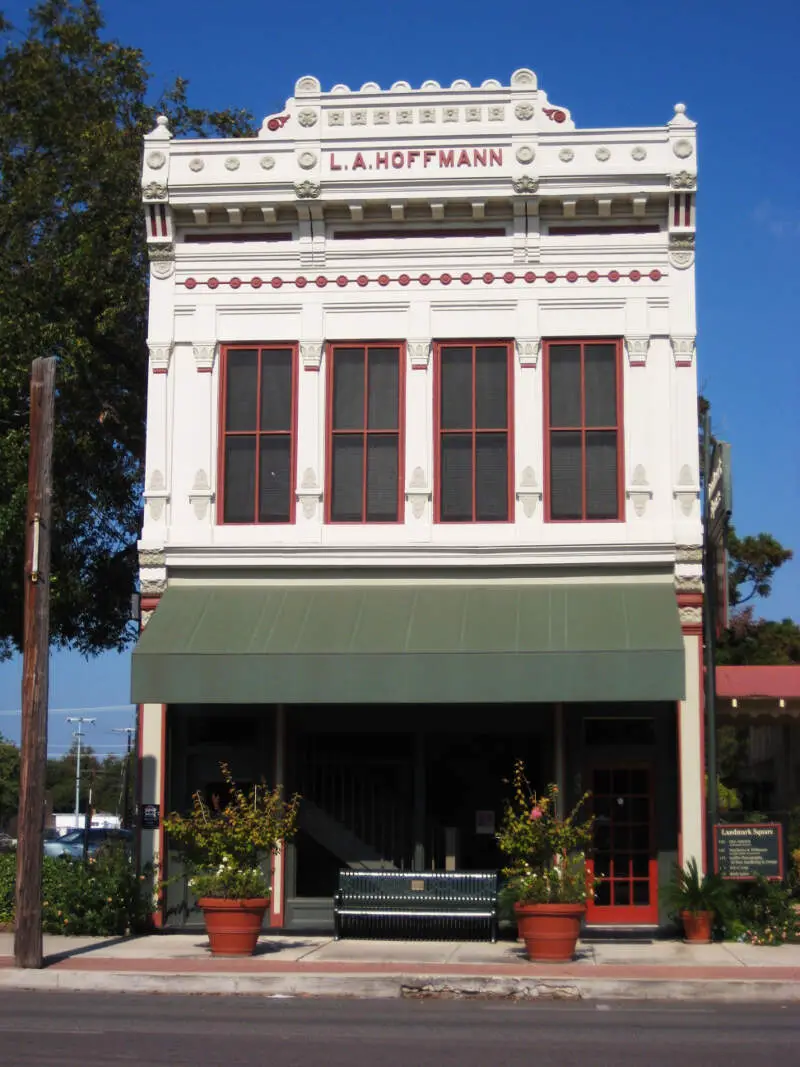
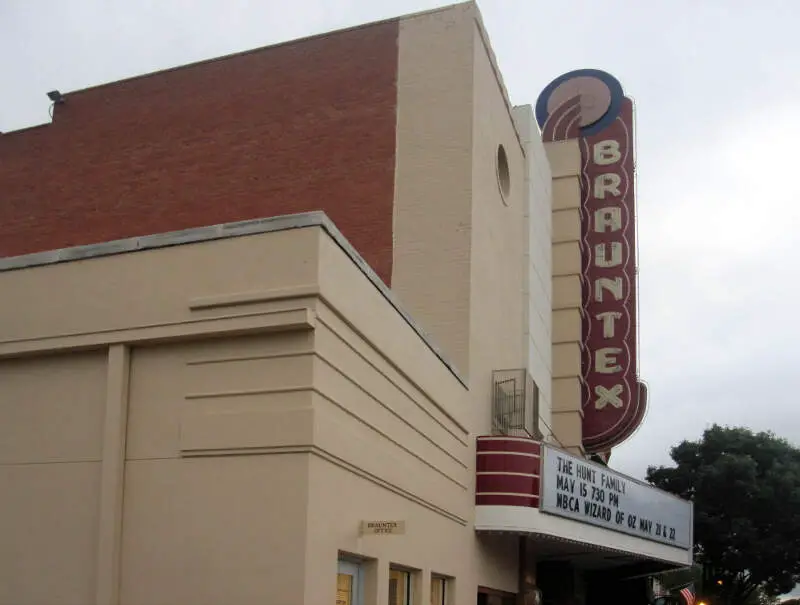
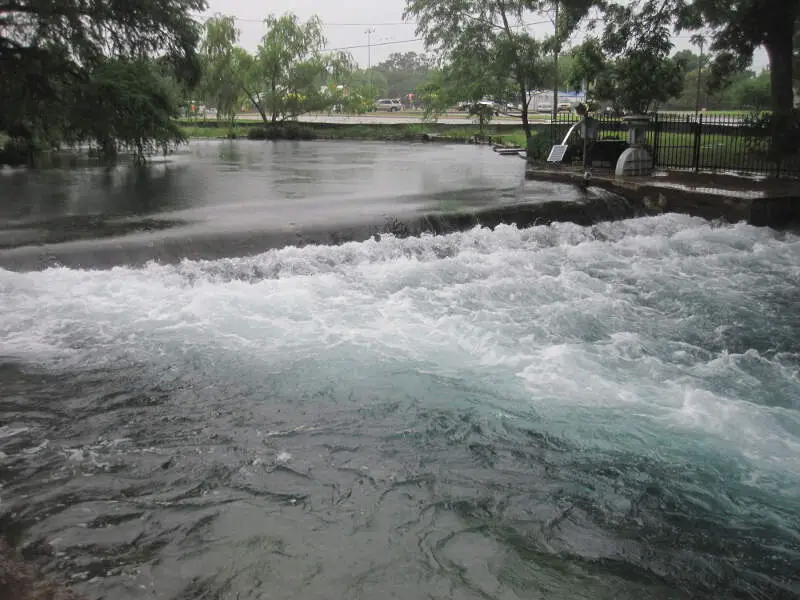
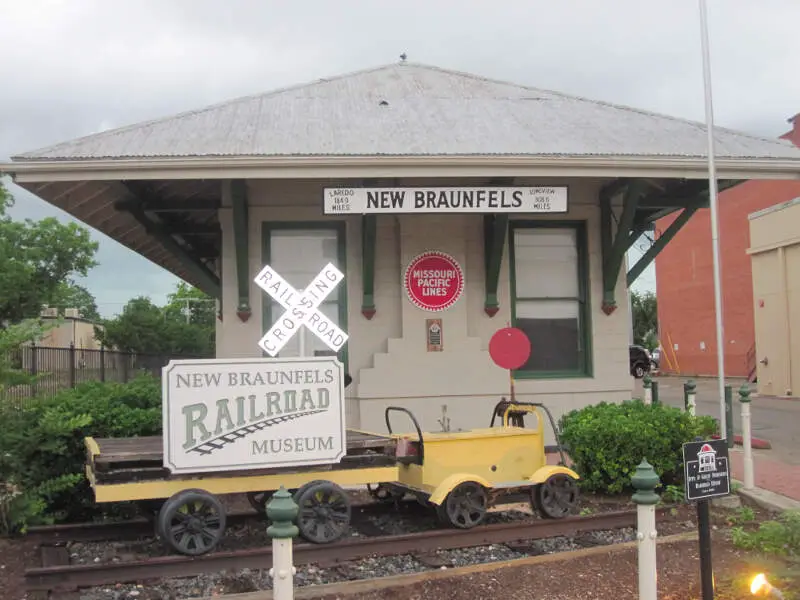
New Braunfels, TX Photos
1 Reviews & Comments About New Braunfels
/5

HomeSnacks User - 2018-09-10 14:59:05.592215
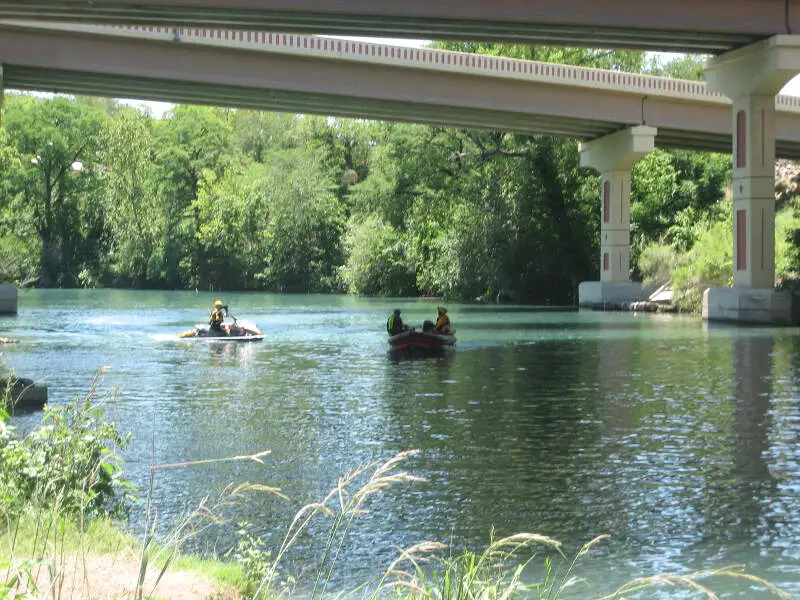
I go to New Braunfels for the Comal and Guadalupe rivers. There's nothing more relaxing than tubing the rivers during the hot Texas summers.
What stands out the most is the beginning of the Comal River which is locate in Landa Park, New Braunfels. The spring-fed river begins here and you can walk right up to the spot where it comes out of the earth and sit there on stone benches that have been carved into the river's wall.
Rankings for New Braunfels in Texas


Locations Around New Braunfels
Map Of New Braunfels, TX
Best Places Around New Braunfels
Cibolo, TX
Population 32,640
Converse, TX
Population 28,052
San Marcos, TX
Population 67,143
Live Oak, TX
Population 15,726
Schertz, TX
Population 42,545
Canyon Lake, TX
Population 32,035
Seguin, TX
Population 30,318
New Braunfels Demographics And Statistics
Population over time in New Braunfels
The current population in New Braunfels is 92,993. The population has increased 72.0% from 2010.
| Year | Population | % Change |
|---|---|---|
| 2022 | 92,993 | 24.7% |
| 2021 | 74,587 | 6.1% |
| 2020 | 70,317 | 4.8% |
| 2019 | 67,097 | 4.7% |
| 2018 | 64,076 | 3.8% |
| 2017 | 61,712 | 3.5% |
| 2016 | 59,620 | 3.2% |
| 2015 | 57,776 | 3.0% |
| 2014 | 56,080 | 3.7% |
| 2013 | 54,072 | - |
Race / Ethnicity in New Braunfels
New Braunfels is:
58.2% White with 54,150 White residents.
2.1% African American with 1,982 African American residents.
0.1% American Indian with 59 American Indian residents.
0.7% Asian with 626 Asian residents.
0.0% Hawaiian with 0 Hawaiian residents.
0.3% Other with 297 Other residents.
2.0% Two Or More with 1,843 Two Or More residents.
36.6% Hispanic with 34,036 Hispanic residents.
| Race | New Braunfels | TX | USA |
|---|---|---|---|
| White | 58.2% | 40.1% | 58.9% |
| African American | 2.1% | 11.8% | 12.1% |
| American Indian | 0.1% | 0.2% | 0.6% |
| Asian | 0.7% | 5.1% | 5.7% |
| Hawaiian | 0.0% | 0.1% | 0.2% |
| Other | 0.3% | 0.3% | 0.4% |
| Two Or More | 2.0% | 2.6% | 3.5% |
| Hispanic | 36.6% | 39.9% | 18.7% |
Gender in New Braunfels
New Braunfels is 49.7% female with 46,245 female residents.
New Braunfels is 50.3% male with 46,747 male residents.
| Gender | New Braunfels | TX | USA |
|---|---|---|---|
| Female | 49.7% | 50.0% | 50.4% |
| Male | 50.3% | 50.0% | 49.6% |
Highest level of educational attainment in New Braunfels for adults over 25
3.0% of adults in New Braunfels completed < 9th grade.
5.0% of adults in New Braunfels completed 9-12th grade.
24.0% of adults in New Braunfels completed high school / ged.
22.0% of adults in New Braunfels completed some college.
8.0% of adults in New Braunfels completed associate's degree.
26.0% of adults in New Braunfels completed bachelor's degree.
9.0% of adults in New Braunfels completed master's degree.
2.0% of adults in New Braunfels completed professional degree.
1.0% of adults in New Braunfels completed doctorate degree.
| Education | New Braunfels | TX | USA |
|---|---|---|---|
| < 9th Grade | 3.0% | 8.0% | 4.0% |
| 9-12th Grade | 5.0% | 7.0% | 6.0% |
| High School / GED | 24.0% | 24.0% | 26.0% |
| Some College | 22.0% | 21.0% | 20.0% |
| Associate's Degree | 8.0% | 8.0% | 9.0% |
| Bachelor's Degree | 26.0% | 21.0% | 21.0% |
| Master's Degree | 9.0% | 8.0% | 10.0% |
| Professional Degree | 2.0% | 2.0% | 2.0% |
| Doctorate Degree | 1.0% | 1.0% | 2.0% |
Household Income For New Braunfels, Texas
3.0% of households in New Braunfels earn Less than $10,000.
2.4% of households in New Braunfels earn $10,000 to $14,999.
4.5% of households in New Braunfels earn $15,000 to $24,999.
7.0% of households in New Braunfels earn $25,000 to $34,999.
8.7% of households in New Braunfels earn $35,000 to $49,999.
17.8% of households in New Braunfels earn $50,000 to $74,999.
16.1% of households in New Braunfels earn $75,000 to $99,999.
21.3% of households in New Braunfels earn $100,000 to $149,999.
10.2% of households in New Braunfels earn $150,000 to $199,999.
9.0% of households in New Braunfels earn $200,000 or more.
| Income | New Braunfels | TX | USA |
|---|---|---|---|
| Less than $10,000 | 3.0% | 5.1% | 4.9% |
| $10,000 to $14,999 | 2.4% | 3.6% | 3.8% |
| $15,000 to $24,999 | 4.5% | 7.0% | 7.0% |
| $25,000 to $34,999 | 7.0% | 7.7% | 7.4% |
| $35,000 to $49,999 | 8.7% | 11.1% | 10.7% |
| $50,000 to $74,999 | 17.8% | 16.7% | 16.1% |
| $75,000 to $99,999 | 16.1% | 12.7% | 12.8% |
| $100,000 to $149,999 | 21.3% | 16.9% | 17.1% |
| $150,000 to $199,999 | 10.2% | 8.7% | 8.8% |
| $200,000 or more | 9.0% | 10.6% | 11.4% |


