San Marcos, TX
Demographics And Statistics
Living In San Marcos, Texas Summary
Life in San Marcos research summary. HomeSnacks has been using Saturday Night Science to research the quality of life in San Marcos over the past nine years using Census, FBI, Zillow, and other primary data sources. Based on the most recently available data, we found the following about life in San Marcos:
The population in San Marcos is 67,143.
The median home value in San Marcos is $338,063.
The median income in San Marcos is $47,394.
The cost of living in San Marcos is 94 which is 0.9x lower than the national average.
The median rent in San Marcos is $1,251.
The unemployment rate in San Marcos is 6.8%.
The poverty rate in San Marcos is 27.7%.
The average high in San Marcos is 79.8° and the average low is 56.7°.
San Marcos SnackAbility
Overall SnackAbility
San Marcos, TX Crime Report
Crime in San Marcos summary. We use data from the FBI to determine the crime rates in San Marcos. Key points include:
There were 2,256 total crimes in San Marcos in the last reporting year.
The overall crime rate per 100,000 people in San Marcos is 3,247.4 / 100k people.
The violent crime rate per 100,000 people in San Marcos is 640.6 / 100k people.
The property crime rate per 100,000 people in San Marcos is 2,606.9 / 100k people.
Overall, crime in San Marcos is 39.72% above the national average.
Total Crimes
Above National Average
Crime In San Marcos Comparison Table
| Statistic | Count Raw |
San Marcos / 100k People |
Texas / 100k People |
National / 100k People |
|---|---|---|---|---|
| Total Crimes Per 100K | 2,256 | 3,247.4 | 2,691.5 | 2,324.2 |
| Violent Crime | 445 | 640.6 | 446.5 | 369.8 |
| Murder | 0 | 0.0 | 6.6 | 6.3 |
| Robbery | 47 | 67.7 | 91.4 | 66.1 |
| Aggravated Assault | 292 | 420.3 | 302.5 | 268.2 |
| Property Crime | 1,811 | 2,606.9 | 2,245.0 | 1,954.4 |
| Burglary | 211 | 303.7 | 370.7 | 269.8 |
| Larceny | 1,380 | 1,986.5 | 1,587.3 | 1,401.9 |
| Car Theft | 220 | 316.7 | 287.0 | 282.7 |
San Marcos, TX Cost Of Living
Cost of living in San Marcos summary. We use data on the cost of living to determine how expensive it is to live in San Marcos. Real estate prices drive most of the variance in cost of living around Texas. Key points include:
The cost of living in San Marcos is 94 with 100 being average.
The cost of living in San Marcos is 0.9x lower than the national average.
The median home value in San Marcos is $338,063.
The median income in San Marcos is $47,394.
San Marcos's Overall Cost Of Living
Lower Than The National Average
Cost Of Living In San Marcos Comparison Table
| Living Expense | San Marcos | Texas | National Average | |
|---|---|---|---|---|
| Overall | 94 | 92 | 100 | |
| Services | 100 | 96 | 100 | |
| Groceries | 87 | 93 | 100 | |
| Health | 101 | 93 | 100 | |
| Housing | 86 | 84 | 100 | |
| Transportation | 105 | 92 | 100 | |
| Utilities | 98 | 104 | 100 | |
San Marcos, TX Weather
The average high in San Marcos is 79.8° and the average low is 56.7°.
There are 50.2 days of precipitation each year.
Expect an average of 33.9 inches of precipitation each year with 0.0 inches of snow.
| Stat | San Marcos |
|---|---|
| Average Annual High | 79.8 |
| Average Annual Low | 56.7 |
| Annual Precipitation Days | 50.2 |
| Average Annual Precipitation | 33.9 |
| Average Annual Snowfall | 0.0 |
Average High
Days of Rain
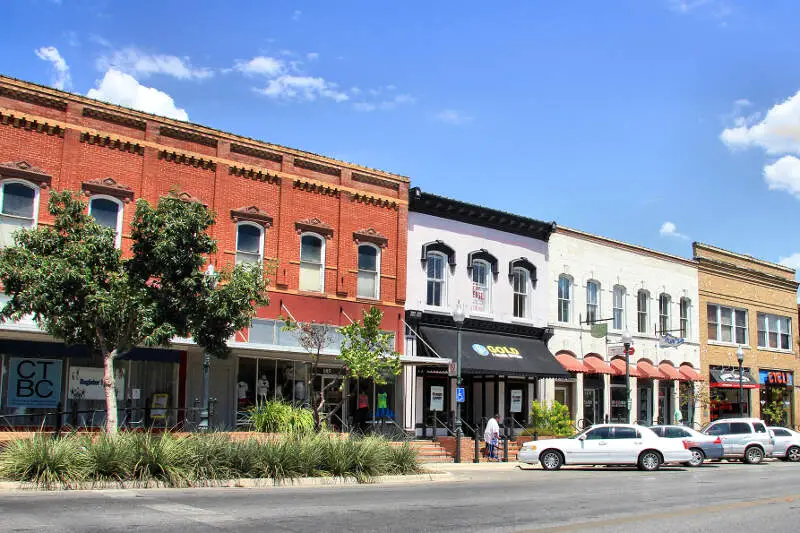
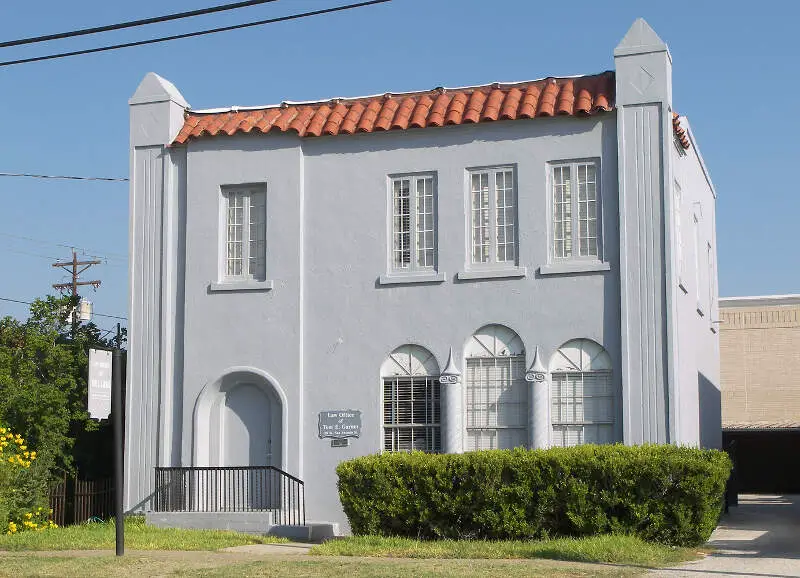
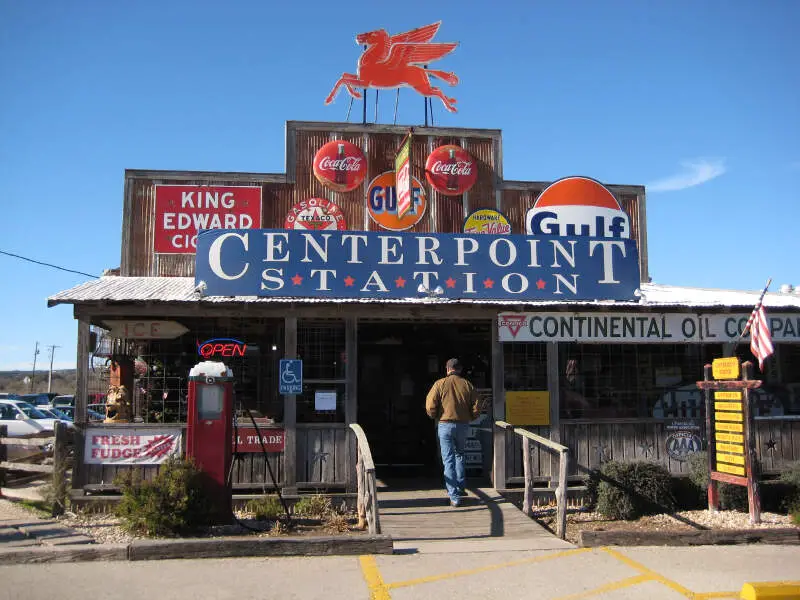
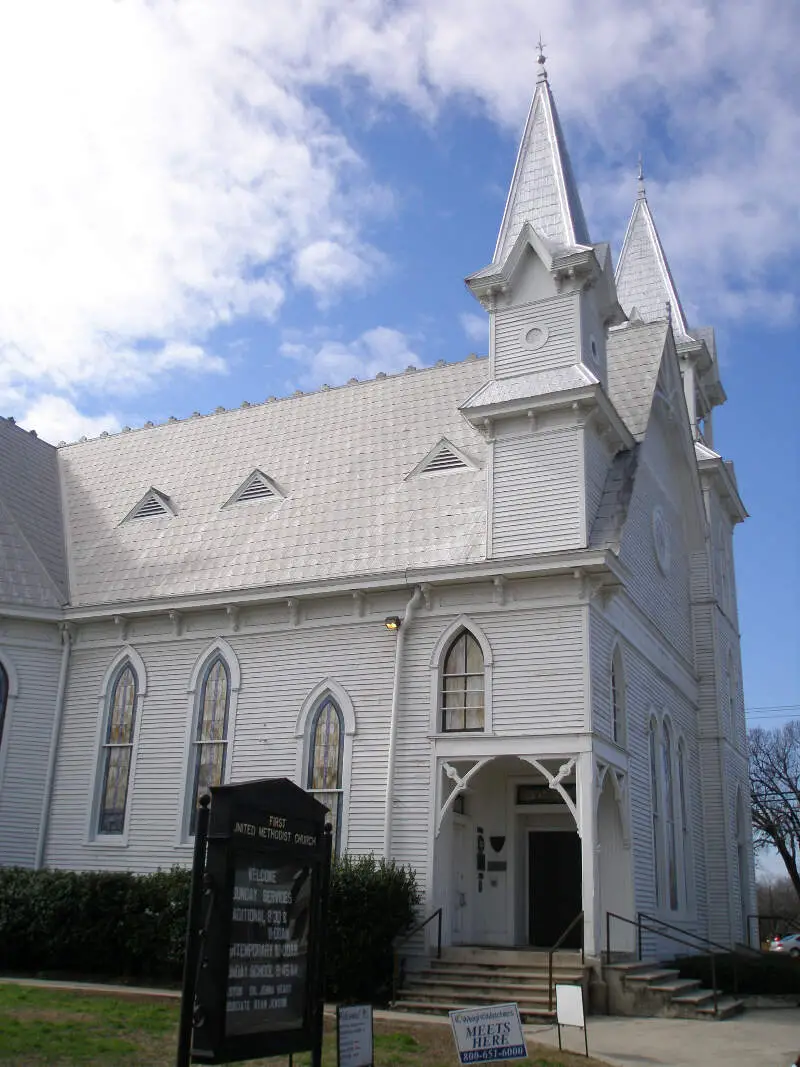
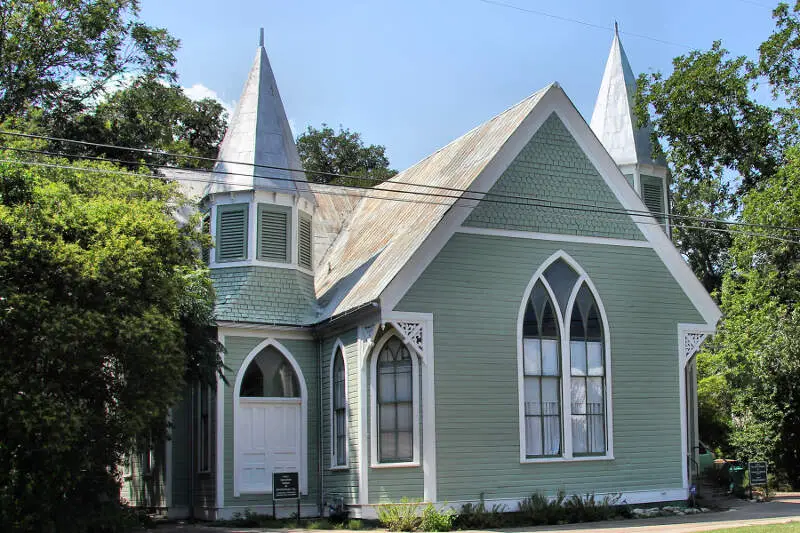
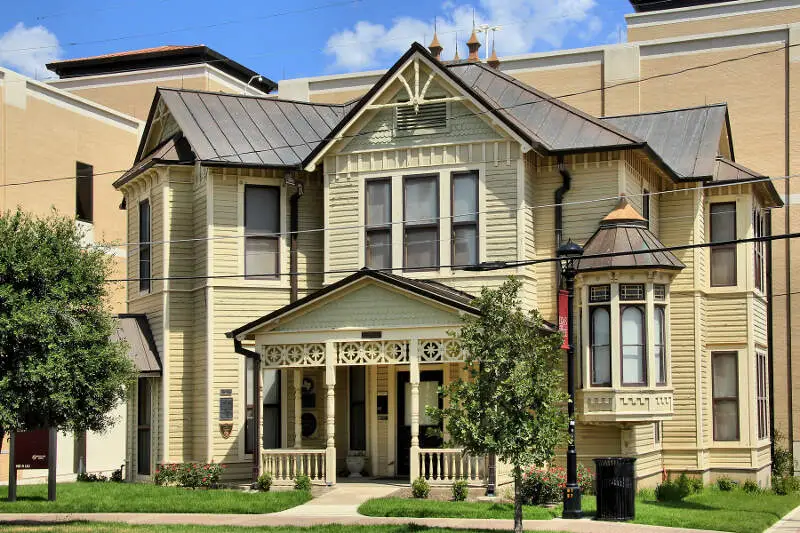
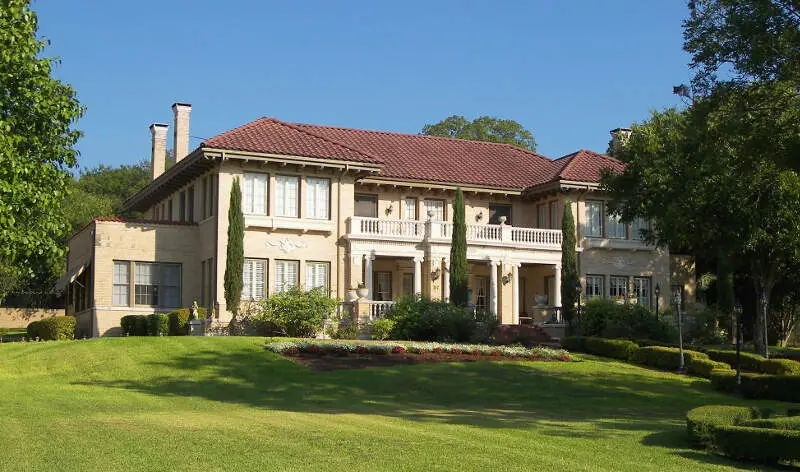
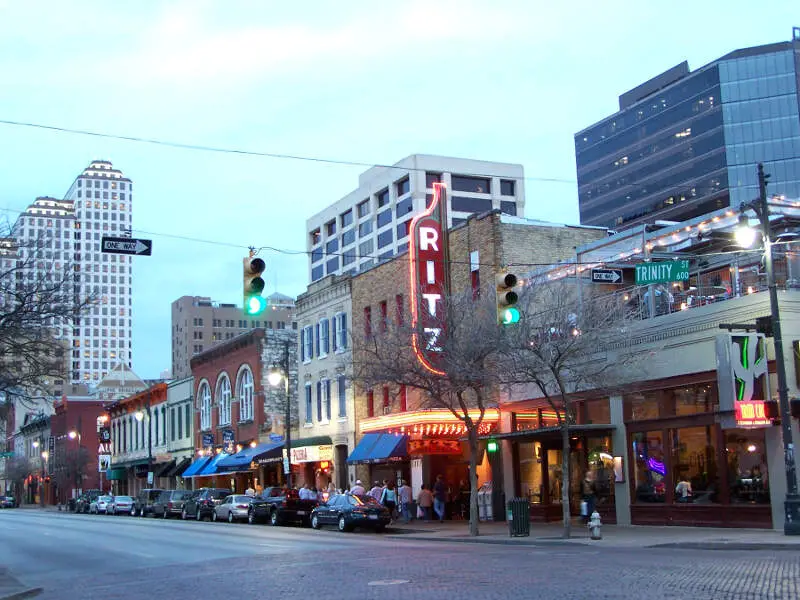
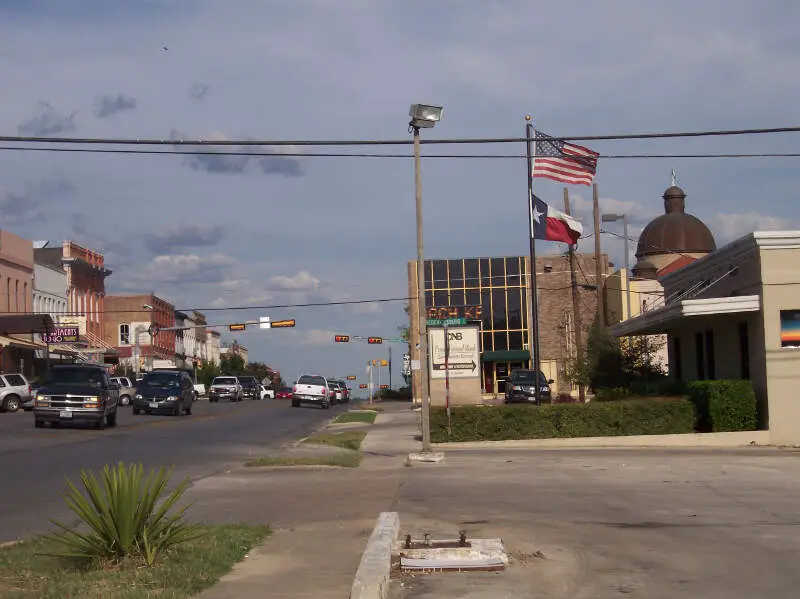
San Marcos, TX Photos
Rankings for San Marcos in Texas


Locations Around San Marcos
Map Of San Marcos, TX
Best Places Around San Marcos
Brushy Creek, TX
Population 22,282
Cedar Park, TX
Population 76,344
Round Rock, TX
Population 120,465
Pflugerville, TX
Population 64,528
Cibolo, TX
Population 32,640
Converse, TX
Population 28,052
Leander, TX
Population 62,491
Kyle, TX
Population 48,484
Boerne, TX
Population 18,475
Timberwood Park, TX
Population 34,253
San Marcos Demographics And Statistics
Population over time in San Marcos
The current population in San Marcos is 67,143. The population has increased 55.1% from 2010.
| Year | Population | % Change |
|---|---|---|
| 2022 | 67,143 | 8.7% |
| 2021 | 61,751 | 3.0% |
| 2020 | 59,935 | 3.8% |
| 2019 | 57,743 | 5.5% |
| 2018 | 54,712 | 6.7% |
| 2017 | 51,289 | 6.2% |
| 2016 | 48,291 | 4.7% |
| 2015 | 46,131 | 3.7% |
| 2014 | 44,486 | 2.8% |
| 2013 | 43,282 | - |
Race / Ethnicity in San Marcos
San Marcos is:
44.9% White with 30,138 White residents.
5.7% African American with 3,821 African American residents.
0.2% American Indian with 137 American Indian residents.
2.2% Asian with 1,502 Asian residents.
0.0% Hawaiian with 11 Hawaiian residents.
1.4% Other with 973 Other residents.
3.6% Two Or More with 2,437 Two Or More residents.
41.9% Hispanic with 28,124 Hispanic residents.
| Race | San Marcos | TX | USA |
|---|---|---|---|
| White | 44.9% | 40.1% | 58.9% |
| African American | 5.7% | 11.8% | 12.1% |
| American Indian | 0.2% | 0.2% | 0.6% |
| Asian | 2.2% | 5.1% | 5.7% |
| Hawaiian | 0.0% | 0.1% | 0.2% |
| Other | 1.4% | 0.3% | 0.4% |
| Two Or More | 3.6% | 2.6% | 3.5% |
| Hispanic | 41.9% | 39.9% | 18.7% |
Gender in San Marcos
San Marcos is 52.4% female with 35,197 female residents.
San Marcos is 47.6% male with 31,946 male residents.
| Gender | San Marcos | TX | USA |
|---|---|---|---|
| Female | 52.4% | 50.0% | 50.4% |
| Male | 47.6% | 50.0% | 49.6% |
Highest level of educational attainment in San Marcos for adults over 25
5.0% of adults in San Marcos completed < 9th grade.
5.0% of adults in San Marcos completed 9-12th grade.
24.0% of adults in San Marcos completed high school / ged.
24.0% of adults in San Marcos completed some college.
7.0% of adults in San Marcos completed associate's degree.
22.0% of adults in San Marcos completed bachelor's degree.
9.0% of adults in San Marcos completed master's degree.
1.0% of adults in San Marcos completed professional degree.
3.0% of adults in San Marcos completed doctorate degree.
| Education | San Marcos | TX | USA |
|---|---|---|---|
| < 9th Grade | 5.0% | 8.0% | 4.0% |
| 9-12th Grade | 5.0% | 7.0% | 6.0% |
| High School / GED | 24.0% | 24.0% | 26.0% |
| Some College | 24.0% | 21.0% | 20.0% |
| Associate's Degree | 7.0% | 8.0% | 9.0% |
| Bachelor's Degree | 22.0% | 21.0% | 21.0% |
| Master's Degree | 9.0% | 8.0% | 10.0% |
| Professional Degree | 1.0% | 2.0% | 2.0% |
| Doctorate Degree | 3.0% | 1.0% | 2.0% |
Household Income For San Marcos, Texas
11.1% of households in San Marcos earn Less than $10,000.
6.1% of households in San Marcos earn $10,000 to $14,999.
9.7% of households in San Marcos earn $15,000 to $24,999.
12.5% of households in San Marcos earn $25,000 to $34,999.
12.8% of households in San Marcos earn $35,000 to $49,999.
21.5% of households in San Marcos earn $50,000 to $74,999.
10.3% of households in San Marcos earn $75,000 to $99,999.
8.5% of households in San Marcos earn $100,000 to $149,999.
3.4% of households in San Marcos earn $150,000 to $199,999.
3.9% of households in San Marcos earn $200,000 or more.
| Income | San Marcos | TX | USA |
|---|---|---|---|
| Less than $10,000 | 11.1% | 5.1% | 4.9% |
| $10,000 to $14,999 | 6.1% | 3.6% | 3.8% |
| $15,000 to $24,999 | 9.7% | 7.0% | 7.0% |
| $25,000 to $34,999 | 12.5% | 7.7% | 7.4% |
| $35,000 to $49,999 | 12.8% | 11.1% | 10.7% |
| $50,000 to $74,999 | 21.5% | 16.7% | 16.1% |
| $75,000 to $99,999 | 10.3% | 12.7% | 12.8% |
| $100,000 to $149,999 | 8.5% | 16.9% | 17.1% |
| $150,000 to $199,999 | 3.4% | 8.7% | 8.8% |
| $200,000 or more | 3.9% | 10.6% | 11.4% |


