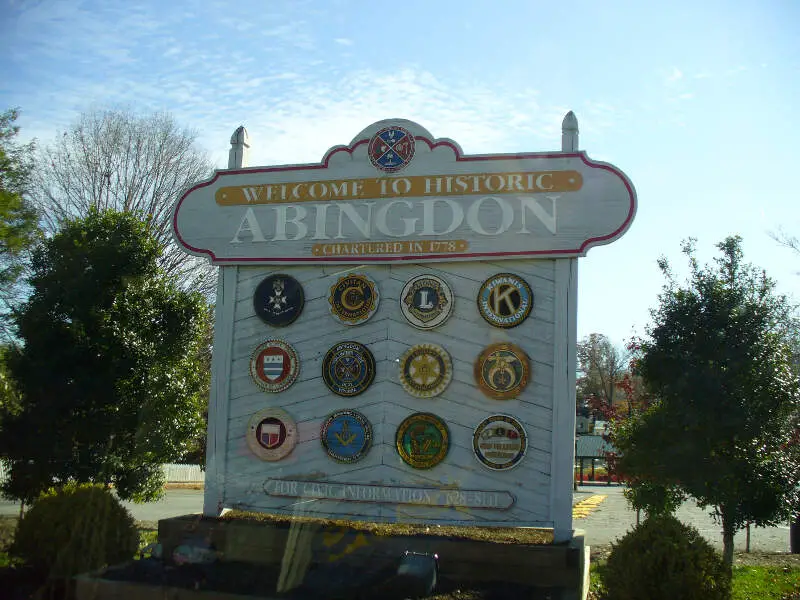
Abingdon, VA
Demographics And Statistics
Living In Abingdon, Virginia Summary
Life in Abingdon research summary. HomeSnacks has been using Saturday Night Science to research the quality of life in Abingdon over the past nine years using Census, FBI, Zillow, and other primary data sources. Based on the most recently available data, we found the following about life in Abingdon:
The population in Abingdon is 8,346.
The median home value in Abingdon is $263,435.
The median income in Abingdon is $56,164.
The cost of living in Abingdon is 93 which is 0.9x lower than the national average.
The median rent in Abingdon is $777.
The unemployment rate in Abingdon is 4.0%.
The poverty rate in Abingdon is 15.7%.
The average high in Abingdon is 66.1° and the average low is 42.9°.
Abingdon SnackAbility
Overall SnackAbility
Abingdon, VA Crime Report
Crime in Abingdon summary. We use data from the FBI to determine the crime rates in Abingdon. Key points include:
There were 143 total crimes in Abingdon in the last reporting year.
The overall crime rate per 100,000 people in Abingdon is 1,730.2 / 100k people.
The violent crime rate per 100,000 people in Abingdon is 193.6 / 100k people.
The property crime rate per 100,000 people in Abingdon is 1,536.6 / 100k people.
Overall, crime in Abingdon is -25.56% below the national average.
Total Crimes
Below National Average
Crime In Abingdon Comparison Table
| Statistic | Count Raw |
Abingdon / 100k People |
Virginia / 100k People |
National / 100k People |
|---|---|---|---|---|
| Total Crimes Per 100K | 143 | 1,730.2 | 1,665.1 | 2,324.2 |
| Violent Crime | 16 | 193.6 | 208.7 | 369.8 |
| Murder | 0 | 0.0 | 6.1 | 6.3 |
| Robbery | 0 | 0.0 | 34.3 | 66.1 |
| Aggravated Assault | 11 | 133.1 | 141.7 | 268.2 |
| Property Crime | 127 | 1,536.6 | 1,456.4 | 1,954.4 |
| Burglary | 13 | 157.3 | 133.5 | 269.8 |
| Larceny | 105 | 1,270.4 | 1,196.6 | 1,401.9 |
| Car Theft | 9 | 108.9 | 126.3 | 282.7 |
Abingdon, VA Cost Of Living
Cost of living in Abingdon summary. We use data on the cost of living to determine how expensive it is to live in Abingdon. Real estate prices drive most of the variance in cost of living around Virginia. Key points include:
The cost of living in Abingdon is 93 with 100 being average.
The cost of living in Abingdon is 0.9x lower than the national average.
The median home value in Abingdon is $263,435.
The median income in Abingdon is $56,164.
Abingdon's Overall Cost Of Living
Lower Than The National Average
Cost Of Living In Abingdon Comparison Table
| Living Expense | Abingdon | Virginia | National Average | |
|---|---|---|---|---|
| Overall | 93 | 102 | 100 | |
| Services | 100 | 102 | 100 | |
| Groceries | 99 | 98 | 100 | |
| Health | 90 | 102 | 100 | |
| Housing | 80 | 107 | 100 | |
| Transportation | 84 | 95 | 100 | |
| Utilities | 100 | 102 | 100 | |
Abingdon, VA Weather
The average high in Abingdon is 66.1° and the average low is 42.9°.
There are 96.5 days of precipitation each year.
Expect an average of 44.8 inches of precipitation each year with 12.2 inches of snow.
| Stat | Abingdon |
|---|---|
| Average Annual High | 66.1 |
| Average Annual Low | 42.9 |
| Annual Precipitation Days | 96.5 |
| Average Annual Precipitation | 44.8 |
| Average Annual Snowfall | 12.2 |
Average High
Days of Rain
Abingdon, VA Photos
1 Reviews & Comments About Abingdon
/5

HomeSnacks User - 2018-07-23 14:16:18.603688
I love the historic feel of this town. The brick sidewalks and crosswalks are the perfect touch to make you feel right at home. There is so much to do and you will love every moment of being there.
Martha Washington Inn and Barter Theater are beautiful center points to this historical town.
Rankings for Abingdon in Virginia


Locations Around Abingdon
Map Of Abingdon, VA
Best Places Around Abingdon
Boone, NC
Population 19,368
Mount Carmel, TN
Population 5,486
Jonesborough, TN
Population 5,891
Church Hill, TN
Population 7,016
Bristol, TN
Population 27,307
Bloomingdale, TN
Population 8,946
Kingsport, TN
Population 55,415
Elizabethton, TN
Population 14,375
Erwin, TN
Population 6,026
Bristol, VA
Population 17,036
Abingdon Demographics And Statistics
Population over time in Abingdon
The current population in Abingdon is 8,346. The population has increased 2.7% from 2010.
| Year | Population | % Change |
|---|---|---|
| 2022 | 8,346 | 4.1% |
| 2021 | 8,020 | -0.3% |
| 2020 | 8,044 | -0.9% |
| 2019 | 8,117 | -0.3% |
| 2018 | 8,143 | -0.4% |
| 2017 | 8,176 | -0.1% |
| 2016 | 8,186 | 0.2% |
| 2015 | 8,166 | 0.0% |
| 2014 | 8,162 | 0.4% |
| 2013 | 8,128 | - |
Race / Ethnicity in Abingdon
Abingdon is:
91.6% White with 7,642 White residents.
3.1% African American with 260 African American residents.
0.3% American Indian with 22 American Indian residents.
2.1% Asian with 174 Asian residents.
0.0% Hawaiian with 0 Hawaiian residents.
0.0% Other with 0 Other residents.
1.7% Two Or More with 144 Two Or More residents.
1.2% Hispanic with 104 Hispanic residents.
| Race | Abingdon | VA | USA |
|---|---|---|---|
| White | 91.6% | 60.0% | 58.9% |
| African American | 3.1% | 18.6% | 12.1% |
| American Indian | 0.3% | 0.1% | 0.6% |
| Asian | 2.1% | 6.8% | 5.7% |
| Hawaiian | 0.0% | 0.1% | 0.2% |
| Other | 0.0% | 0.5% | 0.4% |
| Two Or More | 1.7% | 4.0% | 3.5% |
| Hispanic | 1.2% | 10.0% | 18.7% |
Gender in Abingdon
Abingdon is 50.4% female with 4,206 female residents.
Abingdon is 49.6% male with 4,140 male residents.
| Gender | Abingdon | VA | USA |
|---|---|---|---|
| Female | 50.4% | 50.5% | 50.4% |
| Male | 49.6% | 49.5% | 49.6% |
Highest level of educational attainment in Abingdon for adults over 25
2.0% of adults in Abingdon completed < 9th grade.
5.0% of adults in Abingdon completed 9-12th grade.
25.0% of adults in Abingdon completed high school / ged.
20.0% of adults in Abingdon completed some college.
10.0% of adults in Abingdon completed associate's degree.
24.0% of adults in Abingdon completed bachelor's degree.
9.0% of adults in Abingdon completed master's degree.
3.0% of adults in Abingdon completed professional degree.
2.0% of adults in Abingdon completed doctorate degree.
| Education | Abingdon | VA | USA |
|---|---|---|---|
| < 9th Grade | 2.0% | 4.0% | 4.0% |
| 9-12th Grade | 5.0% | 5.0% | 6.0% |
| High School / GED | 25.0% | 24.0% | 26.0% |
| Some College | 20.0% | 18.0% | 20.0% |
| Associate's Degree | 10.0% | 8.0% | 9.0% |
| Bachelor's Degree | 24.0% | 23.0% | 21.0% |
| Master's Degree | 9.0% | 13.0% | 10.0% |
| Professional Degree | 3.0% | 3.0% | 2.0% |
| Doctorate Degree | 2.0% | 2.0% | 2.0% |
Household Income For Abingdon, Virginia
7.0% of households in Abingdon earn Less than $10,000.
5.8% of households in Abingdon earn $10,000 to $14,999.
14.7% of households in Abingdon earn $15,000 to $24,999.
10.0% of households in Abingdon earn $25,000 to $34,999.
10.2% of households in Abingdon earn $35,000 to $49,999.
15.5% of households in Abingdon earn $50,000 to $74,999.
11.5% of households in Abingdon earn $75,000 to $99,999.
15.1% of households in Abingdon earn $100,000 to $149,999.
3.2% of households in Abingdon earn $150,000 to $199,999.
7.1% of households in Abingdon earn $200,000 or more.
| Income | Abingdon | VA | USA |
|---|---|---|---|
| Less than $10,000 | 7.0% | 4.2% | 4.9% |
| $10,000 to $14,999 | 5.8% | 3.0% | 3.8% |
| $15,000 to $24,999 | 14.7% | 5.8% | 7.0% |
| $25,000 to $34,999 | 10.0% | 6.3% | 7.4% |
| $35,000 to $49,999 | 10.2% | 9.4% | 10.7% |
| $50,000 to $74,999 | 15.5% | 15.0% | 16.1% |
| $75,000 to $99,999 | 11.5% | 12.3% | 12.8% |
| $100,000 to $149,999 | 15.1% | 18.1% | 17.1% |
| $150,000 to $199,999 | 3.2% | 10.4% | 8.8% |
| $200,000 or more | 7.1% | 15.6% | 11.4% |


