Arlington, VA
Demographics And Statistics
Living In Arlington, Virginia Summary
Life in Arlington research summary. HomeSnacks has been using Saturday Night Science to research the quality of life in Arlington over the past nine years using Census, FBI, Zillow, and other primary data sources. Based on the most recently available data, we found the following about life in Arlington:
The population in Arlington is 235,845.
The median home value in Arlington is $761,141.
The median income in Arlington is $137,387.
The cost of living in Arlington is 164 which is 1.6x higher than the national average.
The median rent in Arlington is $2,227.
The unemployment rate in Arlington is 2.8%.
The poverty rate in Arlington is 6.7%.
The average high in Arlington is 66.5° and the average low is 47.0°.
Table Of Contents
Arlington SnackAbility
Overall SnackAbility
Arlington, VA Cost Of Living
Cost of living in Arlington summary. We use data on the cost of living to determine how expensive it is to live in Arlington. Real estate prices drive most of the variance in cost of living around Virginia. Key points include:
The cost of living in Arlington is 164 with 100 being average.
The cost of living in Arlington is 1.6x higher than the national average.
The median home value in Arlington is $761,141.
The median income in Arlington is $137,387.
Arlington's Overall Cost Of Living
Higher Than The National Average
Cost Of Living In Arlington Comparison Table
| Living Expense | Arlington | Virginia | National Average | |
|---|---|---|---|---|
| Overall | 164 | 102 | 100 | |
| Services | 114 | 102 | 100 | |
| Groceries | 112 | 98 | 100 | |
| Health | 115 | 102 | 100 | |
| Housing | 293 | 107 | 100 | |
| Transportation | 109 | 95 | 100 | |
| Utilities | 95 | 102 | 100 | |
Arlington, VA Weather
The average high in Arlington is 66.5° and the average low is 47.0°.
There are 73.2 days of precipitation each year.
Expect an average of 42.8 inches of precipitation each year with 15.5 inches of snow.
| Stat | Arlington |
|---|---|
| Average Annual High | 66.5 |
| Average Annual Low | 47.0 |
| Annual Precipitation Days | 73.2 |
| Average Annual Precipitation | 42.8 |
| Average Annual Snowfall | 15.5 |
Average High
Days of Rain
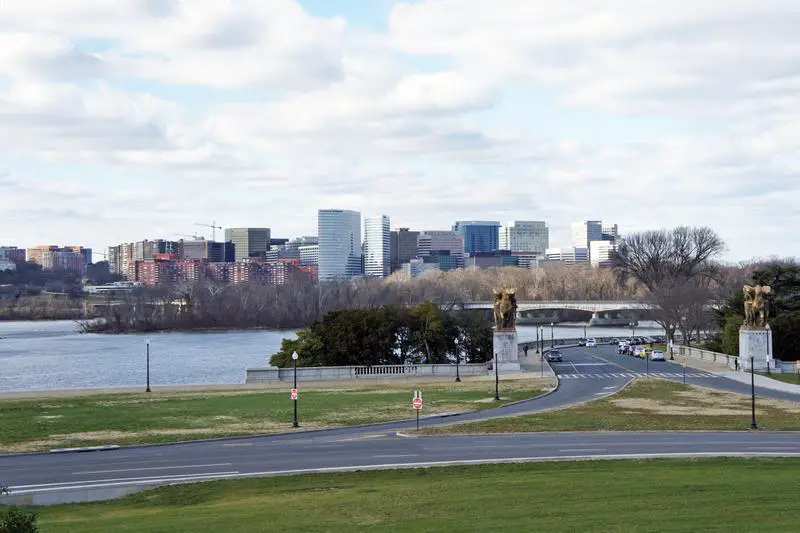
Arlington, VA Photos
Arlington Articles


Rankings for Arlington in Virginia
Locations Around Arlington
Map Of Arlington, VA
Best Places Around Arlington
Four Corners, MD
Population 7,766
North Potomac, MD
Population 24,692
Layhill, MD
Population 5,157
South Kensington, MD
Population 8,371
Colesville, MD
Population 13,704
Olney, MD
Population 35,522
Kemp Mill, MD
Population 14,098
Travilah, MD
Population 10,846
Chevy Chase, MD
Population 9,789
Arlington Demographics And Statistics
Population over time in Arlington
The current population in Arlington is 235,845. The population has increased 19.4% from 2010.
| Year | Population | % Change |
|---|---|---|
| 2022 | 235,845 | 1.7% |
| 2021 | 231,803 | 1.0% |
| 2020 | 229,534 | 1.5% |
| 2019 | 226,092 | 1.0% |
| 2018 | 223,945 | 1.7% |
| 2017 | 220,173 | 2.5% |
| 2016 | 214,861 | 2.8% |
| 2015 | 209,077 | 3.0% |
| 2014 | 202,999 | 2.8% |
| 2013 | 197,467 | - |
Race / Ethnicity in Arlington
Arlington is:
59.5% White with 140,409 White residents.
9.0% African American with 21,342 African American residents.
0.2% American Indian with 393 American Indian residents.
10.3% Asian with 24,224 Asian residents.
0.1% Hawaiian with 166 Hawaiian residents.
0.6% Other with 1,469 Other residents.
4.7% Two Or More with 11,108 Two Or More residents.
15.6% Hispanic with 36,734 Hispanic residents.
| Race | Arlington | VA | USA |
|---|---|---|---|
| White | 59.5% | 60.0% | 58.9% |
| African American | 9.0% | 18.6% | 12.1% |
| American Indian | 0.2% | 0.1% | 0.6% |
| Asian | 10.3% | 6.8% | 5.7% |
| Hawaiian | 0.1% | 0.1% | 0.2% |
| Other | 0.6% | 0.5% | 0.4% |
| Two Or More | 4.7% | 4.0% | 3.5% |
| Hispanic | 15.6% | 10.0% | 18.7% |
Gender in Arlington
Arlington is 49.5% female with 116,815 female residents.
Arlington is 50.5% male with 119,029 male residents.
| Gender | Arlington | VA | USA |
|---|---|---|---|
| Female | 49.5% | 50.5% | 50.4% |
| Male | 50.5% | 49.5% | 49.6% |
Highest level of educational attainment in Arlington for adults over 25
2.0% of adults in Arlington completed < 9th grade.
2.0% of adults in Arlington completed 9-12th grade.
7.0% of adults in Arlington completed high school / ged.
8.0% of adults in Arlington completed some college.
3.0% of adults in Arlington completed associate's degree.
36.0% of adults in Arlington completed bachelor's degree.
28.0% of adults in Arlington completed master's degree.
9.0% of adults in Arlington completed professional degree.
5.0% of adults in Arlington completed doctorate degree.
| Education | Arlington | VA | USA |
|---|---|---|---|
| < 9th Grade | 2.0% | 4.0% | 4.0% |
| 9-12th Grade | 2.0% | 5.0% | 6.0% |
| High School / GED | 7.0% | 24.0% | 26.0% |
| Some College | 8.0% | 18.0% | 20.0% |
| Associate's Degree | 3.0% | 8.0% | 9.0% |
| Bachelor's Degree | 36.0% | 23.0% | 21.0% |
| Master's Degree | 28.0% | 13.0% | 10.0% |
| Professional Degree | 9.0% | 3.0% | 2.0% |
| Doctorate Degree | 5.0% | 2.0% | 2.0% |
Household Income For Arlington, Virginia
3.3% of households in Arlington earn Less than $10,000.
1.6% of households in Arlington earn $10,000 to $14,999.
3.1% of households in Arlington earn $15,000 to $24,999.
3.2% of households in Arlington earn $25,000 to $34,999.
4.6% of households in Arlington earn $35,000 to $49,999.
9.5% of households in Arlington earn $50,000 to $74,999.
11.0% of households in Arlington earn $75,000 to $99,999.
18.7% of households in Arlington earn $100,000 to $149,999.
14.7% of households in Arlington earn $150,000 to $199,999.
30.3% of households in Arlington earn $200,000 or more.
| Income | Arlington | VA | USA |
|---|---|---|---|
| Less than $10,000 | 3.3% | 4.2% | 4.9% |
| $10,000 to $14,999 | 1.6% | 3.0% | 3.8% |
| $15,000 to $24,999 | 3.1% | 5.8% | 7.0% |
| $25,000 to $34,999 | 3.2% | 6.3% | 7.4% |
| $35,000 to $49,999 | 4.6% | 9.4% | 10.7% |
| $50,000 to $74,999 | 9.5% | 15.0% | 16.1% |
| $75,000 to $99,999 | 11.0% | 12.3% | 12.8% |
| $100,000 to $149,999 | 18.7% | 18.1% | 17.1% |
| $150,000 to $199,999 | 14.7% | 10.4% | 8.8% |
| $200,000 or more | 30.3% | 15.6% | 11.4% |


