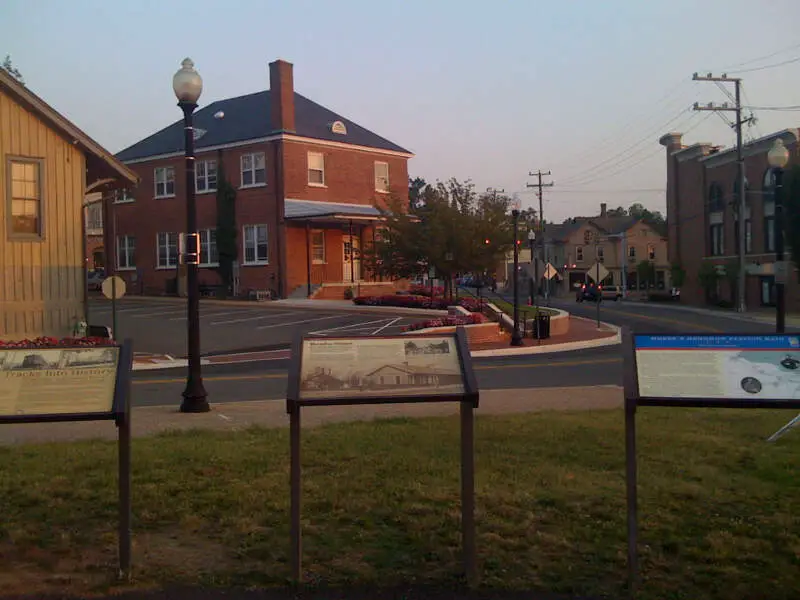
Herndon, VA
Demographics And Statistics
Living In Herndon, Virginia Summary
Life in Herndon research summary. HomeSnacks has been using Saturday Night Science to research the quality of life in Herndon over the past nine years using Census, FBI, Zillow, and other primary data sources. Based on the most recently available data, we found the following about life in Herndon:
The population in Herndon is 24,456.
The median home value in Herndon is $679,629.
The median income in Herndon is $133,403.
The cost of living in Herndon is 140 which is 1.4x higher than the national average.
The median rent in Herndon is $2,029.
The unemployment rate in Herndon is 2.7%.
The poverty rate in Herndon is 7.1%.
The average high in Herndon is 65.7° and the average low is 44.8°.
Herndon SnackAbility
Overall SnackAbility
Herndon, VA Crime Report
Crime in Herndon summary. We use data from the FBI to determine the crime rates in Herndon. Key points include:
There were 472 total crimes in Herndon in the last reporting year.
The overall crime rate per 100,000 people in Herndon is 1,960.9 / 100k people.
The violent crime rate per 100,000 people in Herndon is 253.4 / 100k people.
The property crime rate per 100,000 people in Herndon is 1,707.5 / 100k people.
Overall, crime in Herndon is -15.63% below the national average.
Total Crimes
Below National Average
Crime In Herndon Comparison Table
| Statistic | Count Raw |
Herndon / 100k People |
Virginia / 100k People |
National / 100k People |
|---|---|---|---|---|
| Total Crimes Per 100K | 472 | 1,960.9 | 1,665.1 | 2,324.2 |
| Violent Crime | 61 | 253.4 | 208.7 | 369.8 |
| Murder | 1 | 4.2 | 6.1 | 6.3 |
| Robbery | 26 | 108.0 | 34.3 | 66.1 |
| Aggravated Assault | 26 | 108.0 | 141.7 | 268.2 |
| Property Crime | 411 | 1,707.5 | 1,456.4 | 1,954.4 |
| Burglary | 13 | 54.0 | 133.5 | 269.8 |
| Larceny | 378 | 1,570.4 | 1,196.6 | 1,401.9 |
| Car Theft | 20 | 83.1 | 126.3 | 282.7 |
Herndon, VA Cost Of Living
Cost of living in Herndon summary. We use data on the cost of living to determine how expensive it is to live in Herndon. Real estate prices drive most of the variance in cost of living around Virginia. Key points include:
The cost of living in Herndon is 140 with 100 being average.
The cost of living in Herndon is 1.4x higher than the national average.
The median home value in Herndon is $679,629.
The median income in Herndon is $133,403.
Herndon's Overall Cost Of Living
Higher Than The National Average
Cost Of Living In Herndon Comparison Table
| Living Expense | Herndon | Virginia | National Average | |
|---|---|---|---|---|
| Overall | 140 | 102 | 100 | |
| Services | 113 | 102 | 100 | |
| Groceries | 108 | 98 | 100 | |
| Health | 87 | 102 | 100 | |
| Housing | 210 | 107 | 100 | |
| Transportation | 105 | 95 | 100 | |
| Utilities | 110 | 102 | 100 | |
Herndon, VA Weather
The average high in Herndon is 65.7° and the average low is 44.8°.
There are 73.4 days of precipitation each year.
Expect an average of 42.2 inches of precipitation each year with 21.5 inches of snow.
| Stat | Herndon |
|---|---|
| Average Annual High | 65.7 |
| Average Annual Low | 44.8 |
| Annual Precipitation Days | 73.4 |
| Average Annual Precipitation | 42.2 |
| Average Annual Snowfall | 21.5 |
Average High
Days of Rain
Herndon, VA Photos
Rankings for Herndon in Virginia


Locations Around Herndon
Map Of Herndon, VA
Best Places Around Herndon
North Potomac, MD
Population 24,692
South Kensington, MD
Population 8,371
Clarksburg, MD
Population 28,337
Travilah, MD
Population 10,846
Chevy Chase, MD
Population 9,789
Chevy Chase, MD
Population 9,789
Chevy Chase, MD
Population 9,789
Darnestown, MD
Population 6,672
Franklin Farm, VA
Population 18,903
Bethesda, MD
Population 66,316
Herndon Demographics And Statistics
Population over time in Herndon
The current population in Herndon is 24,456. The population has increased 7.6% from 2010.
| Year | Population | % Change |
|---|---|---|
| 2022 | 24,456 | -0.3% |
| 2021 | 24,520 | -0.1% |
| 2020 | 24,545 | 0.5% |
| 2019 | 24,415 | 0.1% |
| 2018 | 24,384 | 1.0% |
| 2017 | 24,141 | 1.5% |
| 2016 | 23,791 | 1.6% |
| 2015 | 23,424 | 1.9% |
| 2014 | 22,996 | 1.2% |
| 2013 | 22,726 | - |
Race / Ethnicity in Herndon
Herndon is:
34.8% White with 8,514 White residents.
7.4% African American with 1,801 African American residents.
0.3% American Indian with 62 American Indian residents.
15.9% Asian with 3,899 Asian residents.
0.0% Hawaiian with 0 Hawaiian residents.
0.8% Other with 190 Other residents.
3.5% Two Or More with 847 Two Or More residents.
37.4% Hispanic with 9,143 Hispanic residents.
| Race | Herndon | VA | USA |
|---|---|---|---|
| White | 34.8% | 60.0% | 58.9% |
| African American | 7.4% | 18.6% | 12.1% |
| American Indian | 0.3% | 0.1% | 0.6% |
| Asian | 15.9% | 6.8% | 5.7% |
| Hawaiian | 0.0% | 0.1% | 0.2% |
| Other | 0.8% | 0.5% | 0.4% |
| Two Or More | 3.5% | 4.0% | 3.5% |
| Hispanic | 37.4% | 10.0% | 18.7% |
Gender in Herndon
Herndon is 46.9% female with 11,460 female residents.
Herndon is 53.1% male with 12,996 male residents.
| Gender | Herndon | VA | USA |
|---|---|---|---|
| Female | 46.9% | 50.5% | 50.4% |
| Male | 53.1% | 49.5% | 49.6% |
Highest level of educational attainment in Herndon for adults over 25
11.0% of adults in Herndon completed < 9th grade.
5.0% of adults in Herndon completed 9-12th grade.
15.0% of adults in Herndon completed high school / ged.
12.0% of adults in Herndon completed some college.
5.0% of adults in Herndon completed associate's degree.
32.0% of adults in Herndon completed bachelor's degree.
18.0% of adults in Herndon completed master's degree.
1.0% of adults in Herndon completed professional degree.
1.0% of adults in Herndon completed doctorate degree.
| Education | Herndon | VA | USA |
|---|---|---|---|
| < 9th Grade | 11.0% | 4.0% | 4.0% |
| 9-12th Grade | 5.0% | 5.0% | 6.0% |
| High School / GED | 15.0% | 24.0% | 26.0% |
| Some College | 12.0% | 18.0% | 20.0% |
| Associate's Degree | 5.0% | 8.0% | 9.0% |
| Bachelor's Degree | 32.0% | 23.0% | 21.0% |
| Master's Degree | 18.0% | 13.0% | 10.0% |
| Professional Degree | 1.0% | 3.0% | 2.0% |
| Doctorate Degree | 1.0% | 2.0% | 2.0% |
Household Income For Herndon, Virginia
1.7% of households in Herndon earn Less than $10,000.
2.1% of households in Herndon earn $10,000 to $14,999.
1.3% of households in Herndon earn $15,000 to $24,999.
4.2% of households in Herndon earn $25,000 to $34,999.
4.3% of households in Herndon earn $35,000 to $49,999.
9.0% of households in Herndon earn $50,000 to $74,999.
12.2% of households in Herndon earn $75,000 to $99,999.
19.4% of households in Herndon earn $100,000 to $149,999.
13.1% of households in Herndon earn $150,000 to $199,999.
32.7% of households in Herndon earn $200,000 or more.
| Income | Herndon | VA | USA |
|---|---|---|---|
| Less than $10,000 | 1.7% | 4.2% | 4.9% |
| $10,000 to $14,999 | 2.1% | 3.0% | 3.8% |
| $15,000 to $24,999 | 1.3% | 5.8% | 7.0% |
| $25,000 to $34,999 | 4.2% | 6.3% | 7.4% |
| $35,000 to $49,999 | 4.3% | 9.4% | 10.7% |
| $50,000 to $74,999 | 9.0% | 15.0% | 16.1% |
| $75,000 to $99,999 | 12.2% | 12.3% | 12.8% |
| $100,000 to $149,999 | 19.4% | 18.1% | 17.1% |
| $150,000 to $199,999 | 13.1% | 10.4% | 8.8% |
| $200,000 or more | 32.7% | 15.6% | 11.4% |


