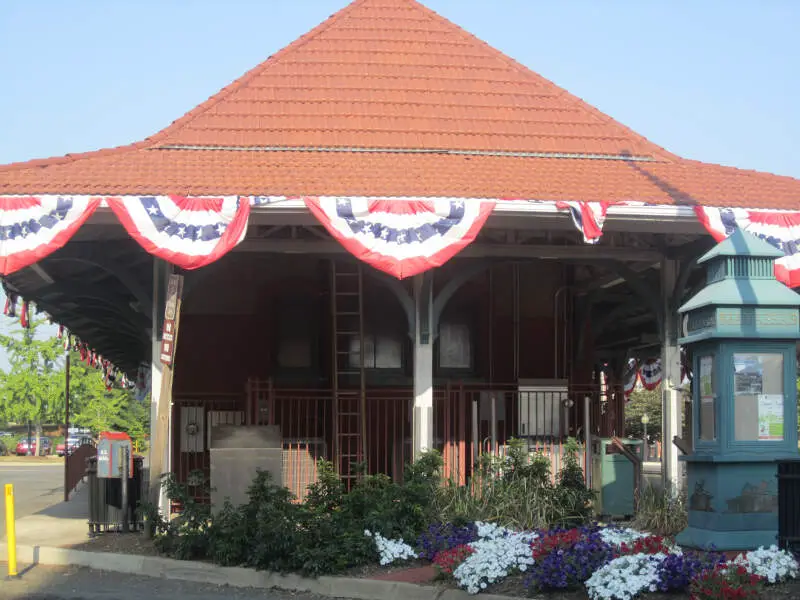
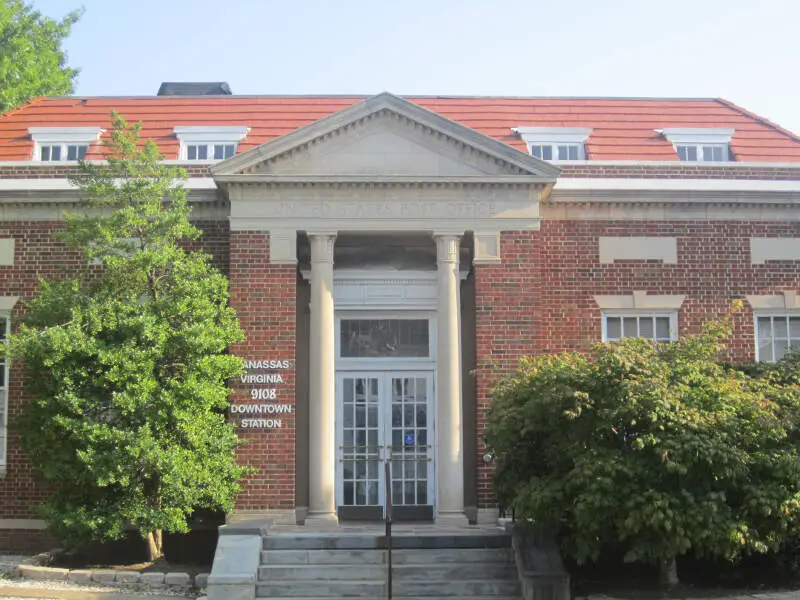
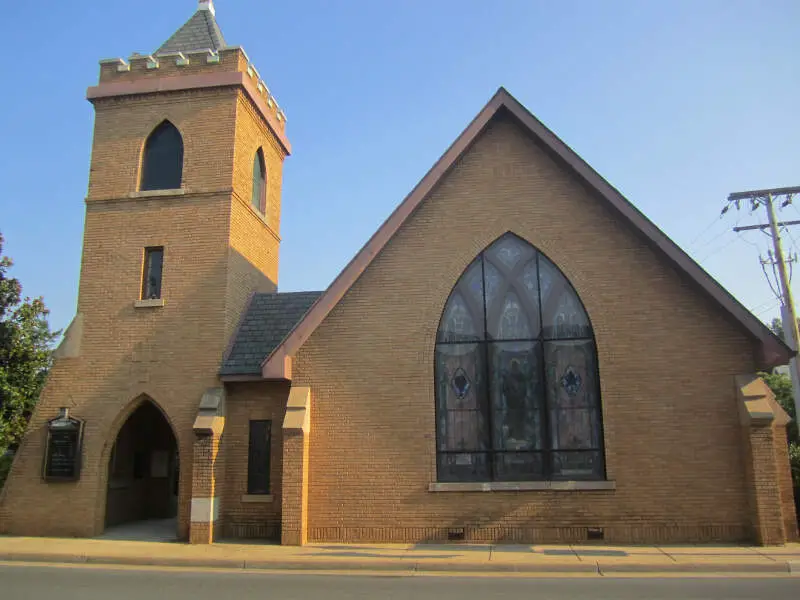
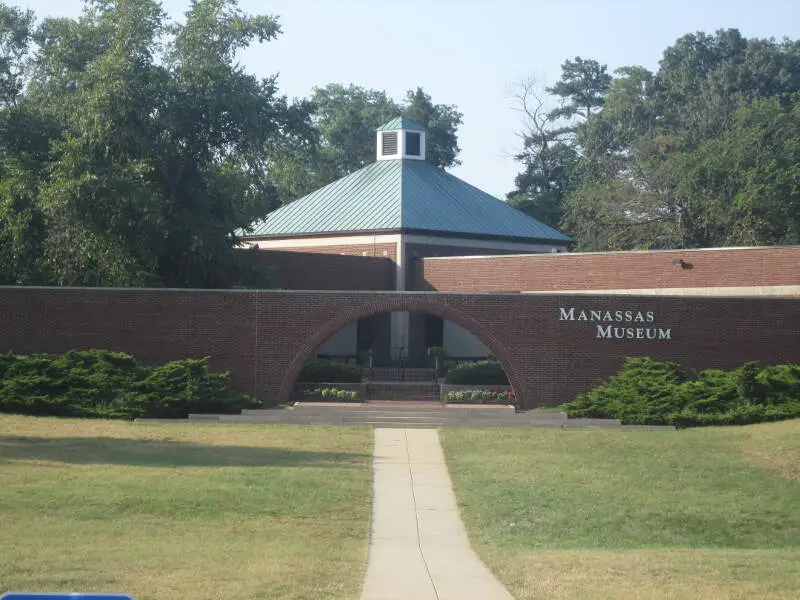
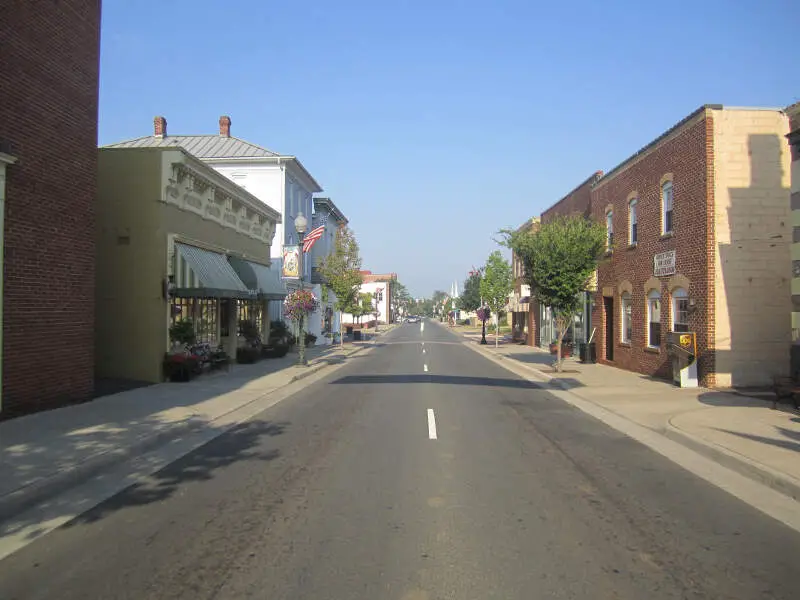
Manassas, VA
Demographics And Statistics
Living In Manassas, Virginia Summary
Life in Manassas research summary. HomeSnacks has been using Saturday Night Science to research the quality of life in Manassas over the past nine years using Census, FBI, Zillow, and other primary data sources. Based on the most recently available data, we found the following about life in Manassas:
The population in Manassas is 42,620.
The median home value in Manassas is $514,283.
The median income in Manassas is $110,559.
The cost of living in Manassas is 122 which is 1.2x higher than the national average.
The median rent in Manassas is $1,784.
The unemployment rate in Manassas is 3.3%.
The poverty rate in Manassas is 4.7%.
The average high in Manassas is 66.3° and the average low is 44.3°.
Manassas SnackAbility
Overall SnackAbility
Manassas, VA Crime Report
Crime in Manassas summary. We use data from the FBI to determine the crime rates in Manassas. Key points include:
There were 1,074 total crimes in Manassas in the last reporting year.
The overall crime rate per 100,000 people in Manassas is 2,507.2 / 100k people.
The violent crime rate per 100,000 people in Manassas is 294.1 / 100k people.
The property crime rate per 100,000 people in Manassas is 2,213.1 / 100k people.
Overall, crime in Manassas is 7.88% above the national average.
Total Crimes
Above National Average
Crime In Manassas Comparison Table
| Statistic | Count Raw |
Manassas / 100k People |
Virginia / 100k People |
National / 100k People |
|---|---|---|---|---|
| Total Crimes Per 100K | 1,074 | 2,507.2 | 1,665.1 | 2,324.2 |
| Violent Crime | 126 | 294.1 | 208.7 | 369.8 |
| Murder | 0 | 0.0 | 6.1 | 6.3 |
| Robbery | 38 | 88.7 | 34.3 | 66.1 |
| Aggravated Assault | 67 | 156.4 | 141.7 | 268.2 |
| Property Crime | 948 | 2,213.1 | 1,456.4 | 1,954.4 |
| Burglary | 50 | 116.7 | 133.5 | 269.8 |
| Larceny | 823 | 1,921.3 | 1,196.6 | 1,401.9 |
| Car Theft | 75 | 175.1 | 126.3 | 282.7 |
Manassas, VA Cost Of Living
Cost of living in Manassas summary. We use data on the cost of living to determine how expensive it is to live in Manassas. Real estate prices drive most of the variance in cost of living around Virginia. Key points include:
The cost of living in Manassas is 122 with 100 being average.
The cost of living in Manassas is 1.2x higher than the national average.
The median home value in Manassas is $514,283.
The median income in Manassas is $110,559.
Manassas's Overall Cost Of Living
Higher Than The National Average
Cost Of Living In Manassas Comparison Table
| Living Expense | Manassas | Virginia | National Average | |
|---|---|---|---|---|
| Overall | 122 | 102 | 100 | |
| Services | 114 | 102 | 100 | |
| Groceries | 108 | 98 | 100 | |
| Health | 112 | 102 | 100 | |
| Housing | 156 | 107 | 100 | |
| Transportation | 111 | 95 | 100 | |
| Utilities | 97 | 102 | 100 | |
Manassas, VA Weather
The average high in Manassas is 66.3° and the average low is 44.3°.
There are 73.4 days of precipitation each year.
Expect an average of 41.7 inches of precipitation each year with 21.5 inches of snow.
| Stat | Manassas |
|---|---|
| Average Annual High | 66.3 |
| Average Annual Low | 44.3 |
| Annual Precipitation Days | 73.4 |
| Average Annual Precipitation | 41.7 |
| Average Annual Snowfall | 21.5 |
Average High
Days of Rain
Manassas, VA Photos
2 Reviews & Comments About Manassas
/5

703 CRUIZ'N -
Virginia is a very expensive place to live specially in Northern Virginia. I'm from Manassas and I like Virginia there's a lot of history here and a lot of nature to explore.
HomeSnacks User - 2018-07-15 02:52:33.224112
Low crime. Good people. Close to DC. Plenty to do.
Lots of free family activities. Traffic is terrible on 28.
Rankings for Manassas in Virginia


Locations Around Manassas
Map Of Manassas, VA
Best Places Around Manassas
Franklin Farm, VA
Population 18,903
Floris, VA
Population 7,417
Broadlands, VA
Population 14,582
Dranesville, VA
Population 12,154
South Run, VA
Population 6,940
Crosspointe, VA
Population 5,305
Dunn Loring, VA
Population 8,707
South Riding, VA
Population 33,358
Burke, VA
Population 44,228
Kings Park West, VA
Population 13,254
Manassas Demographics And Statistics
Population over time in Manassas
The current population in Manassas is 42,620. The population has increased 18.2% from 2010.
| Year | Population | % Change |
|---|---|---|
| 2022 | 42,620 | 2.8% |
| 2021 | 41,457 | 0.2% |
| 2020 | 41,379 | 0.6% |
| 2019 | 41,149 | 1.0% |
| 2018 | 40,743 | 0.8% |
| 2017 | 40,436 | 2.8% |
| 2016 | 39,317 | 3.6% |
| 2015 | 37,943 | 3.1% |
| 2014 | 36,811 | 2.1% |
| 2013 | 36,067 | - |
Race / Ethnicity in Manassas
Manassas is:
37.8% White with 16,107 White residents.
13.0% African American with 5,552 African American residents.
0.1% American Indian with 46 American Indian residents.
6.0% Asian with 2,536 Asian residents.
0.0% Hawaiian with 11 Hawaiian residents.
0.4% Other with 183 Other residents.
3.9% Two Or More with 1,658 Two Or More residents.
38.8% Hispanic with 16,527 Hispanic residents.
| Race | Manassas | VA | USA |
|---|---|---|---|
| White | 37.8% | 60.0% | 58.9% |
| African American | 13.0% | 18.6% | 12.1% |
| American Indian | 0.1% | 0.1% | 0.6% |
| Asian | 6.0% | 6.8% | 5.7% |
| Hawaiian | 0.0% | 0.1% | 0.2% |
| Other | 0.4% | 0.5% | 0.4% |
| Two Or More | 3.9% | 4.0% | 3.5% |
| Hispanic | 38.8% | 10.0% | 18.7% |
Gender in Manassas
Manassas is 49.2% female with 20,988 female residents.
Manassas is 50.8% male with 21,631 male residents.
| Gender | Manassas | VA | USA |
|---|---|---|---|
| Female | 49.2% | 50.5% | 50.4% |
| Male | 50.8% | 49.5% | 49.6% |
Highest level of educational attainment in Manassas for adults over 25
8.0% of adults in Manassas completed < 9th grade.
6.0% of adults in Manassas completed 9-12th grade.
29.0% of adults in Manassas completed high school / ged.
15.0% of adults in Manassas completed some college.
7.0% of adults in Manassas completed associate's degree.
22.0% of adults in Manassas completed bachelor's degree.
10.0% of adults in Manassas completed master's degree.
2.0% of adults in Manassas completed professional degree.
1.0% of adults in Manassas completed doctorate degree.
| Education | Manassas | VA | USA |
|---|---|---|---|
| < 9th Grade | 8.0% | 4.0% | 4.0% |
| 9-12th Grade | 6.0% | 5.0% | 6.0% |
| High School / GED | 29.0% | 24.0% | 26.0% |
| Some College | 15.0% | 18.0% | 20.0% |
| Associate's Degree | 7.0% | 8.0% | 9.0% |
| Bachelor's Degree | 22.0% | 23.0% | 21.0% |
| Master's Degree | 10.0% | 13.0% | 10.0% |
| Professional Degree | 2.0% | 3.0% | 2.0% |
| Doctorate Degree | 1.0% | 2.0% | 2.0% |
Household Income For Manassas, Virginia
1.3% of households in Manassas earn Less than $10,000.
2.3% of households in Manassas earn $10,000 to $14,999.
2.5% of households in Manassas earn $15,000 to $24,999.
4.5% of households in Manassas earn $25,000 to $34,999.
6.5% of households in Manassas earn $35,000 to $49,999.
13.1% of households in Manassas earn $50,000 to $74,999.
14.7% of households in Manassas earn $75,000 to $99,999.
22.8% of households in Manassas earn $100,000 to $149,999.
13.2% of households in Manassas earn $150,000 to $199,999.
19.1% of households in Manassas earn $200,000 or more.
| Income | Manassas | VA | USA |
|---|---|---|---|
| Less than $10,000 | 1.3% | 4.2% | 4.9% |
| $10,000 to $14,999 | 2.3% | 3.0% | 3.8% |
| $15,000 to $24,999 | 2.5% | 5.8% | 7.0% |
| $25,000 to $34,999 | 4.5% | 6.3% | 7.4% |
| $35,000 to $49,999 | 6.5% | 9.4% | 10.7% |
| $50,000 to $74,999 | 13.1% | 15.0% | 16.1% |
| $75,000 to $99,999 | 14.7% | 12.3% | 12.8% |
| $100,000 to $149,999 | 22.8% | 18.1% | 17.1% |
| $150,000 to $199,999 | 13.2% | 10.4% | 8.8% |
| $200,000 or more | 19.1% | 15.6% | 11.4% |


