Grafton, WI
Demographics And Statistics
Living In Grafton, Wisconsin Summary
Life in Grafton research summary. HomeSnacks has been using Saturday Night Science to research the quality of life in Grafton over the past nine years using Census, FBI, Zillow, and other primary data sources. Based on the most recently available data, we found the following about life in Grafton:
The population in Grafton is 12,160.
The median home value in Grafton is $377,473.
The median income in Grafton is $83,500.
The cost of living in Grafton is 102 which is 1.0x higher than the national average.
The median rent in Grafton is $1,109.
The unemployment rate in Grafton is 2.0%.
The poverty rate in Grafton is 3.8%.
The average high in Grafton is None° and the average low is None°.
Grafton SnackAbility
Overall SnackAbility
Grafton, WI Crime Report
Crime in Grafton summary. We use data from the FBI to determine the crime rates in Grafton. Key points include:
There were 121 total crimes in Grafton in the last reporting year.
The overall crime rate per 100,000 people in Grafton is 970.3 / 100k people.
The violent crime rate per 100,000 people in Grafton is 48.1 / 100k people.
The property crime rate per 100,000 people in Grafton is 922.1 / 100k people.
Overall, crime in Grafton is -58.25% below the national average.
Total Crimes
Below National Average
Crime In Grafton Comparison Table
| Statistic | Count Raw |
Grafton / 100k People |
Wisconsin / 100k People |
National / 100k People |
|---|---|---|---|---|
| Total Crimes Per 100K | 121 | 970.3 | 1,809.0 | 2,324.2 |
| Violent Crime | 6 | 48.1 | 323.4 | 369.8 |
| Murder | 0 | 0.0 | 5.3 | 6.3 |
| Robbery | 1 | 8.0 | 52.8 | 66.1 |
| Aggravated Assault | 2 | 16.0 | 230.6 | 268.2 |
| Property Crime | 115 | 922.1 | 1,485.7 | 1,954.4 |
| Burglary | 4 | 32.1 | 218.5 | 269.8 |
| Larceny | 108 | 866.0 | 1,106.1 | 1,401.9 |
| Car Theft | 3 | 24.1 | 161.0 | 282.7 |
Grafton, WI Cost Of Living
Cost of living in Grafton summary. We use data on the cost of living to determine how expensive it is to live in Grafton. Real estate prices drive most of the variance in cost of living around Wisconsin. Key points include:
The cost of living in Grafton is 102 with 100 being average.
The cost of living in Grafton is 1.0x higher than the national average.
The median home value in Grafton is $377,473.
The median income in Grafton is $83,500.
Grafton's Overall Cost Of Living
Higher Than The National Average
Cost Of Living In Grafton Comparison Table
| Living Expense | Grafton | Wisconsin | National Average | |
|---|---|---|---|---|
| Overall | 102 | 95 | 100 | |
| Services | 98 | 97 | 100 | |
| Groceries | 98 | 98 | 100 | |
| Health | 120 | 114 | 100 | |
| Housing | 104 | 84 | 100 | |
| Transportation | 93 | 96 | 100 | |
| Utilities | 108 | 103 | 100 | |
Grafton, WI Weather
The average high in Grafton is None° and the average low is None°.
There are None days of precipitation each year.
Expect an average of None inches of precipitation each year with None inches of snow.
| Stat | Grafton |
|---|---|
| Average Annual High | None |
| Average Annual Low | None |
| Annual Precipitation Days | None |
| Average Annual Precipitation | None |
| Average Annual Snowfall | None |
Average High
Days of Rain
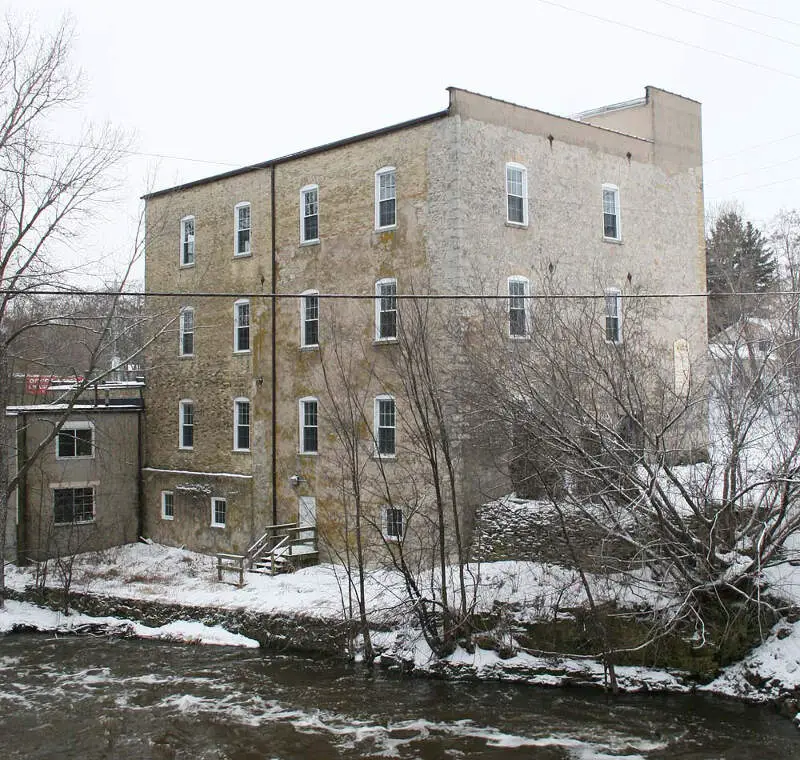
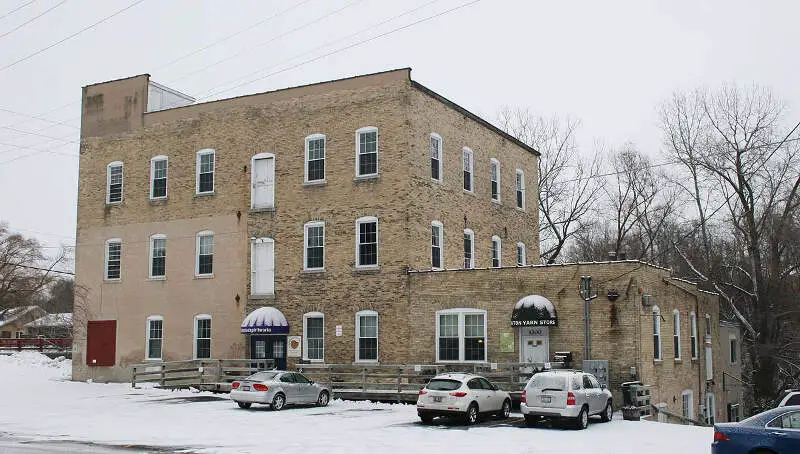
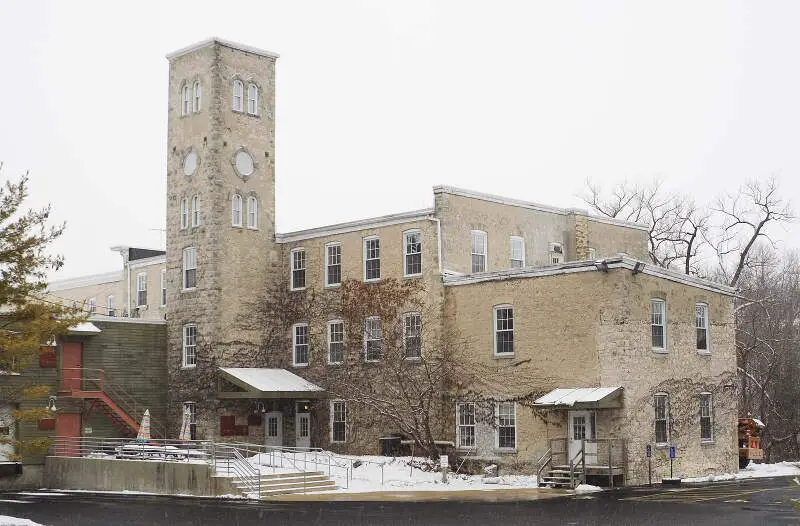
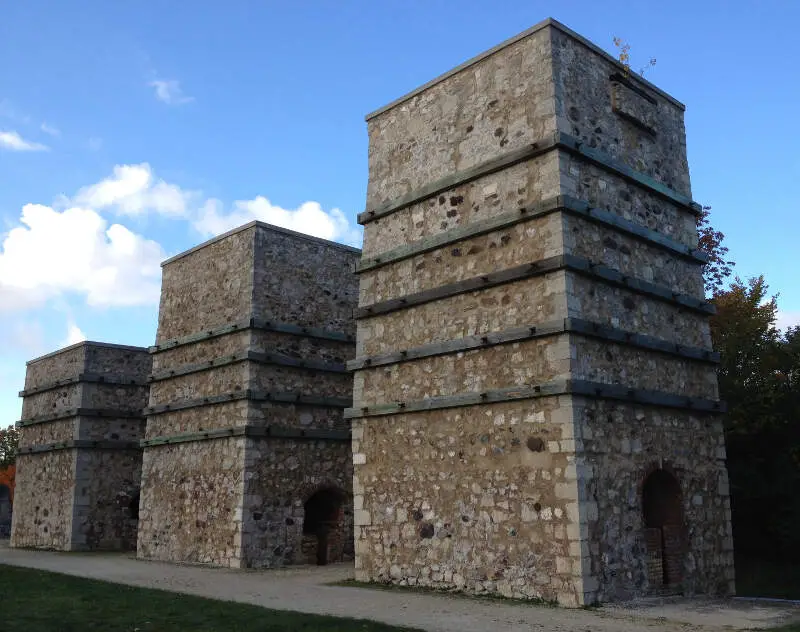
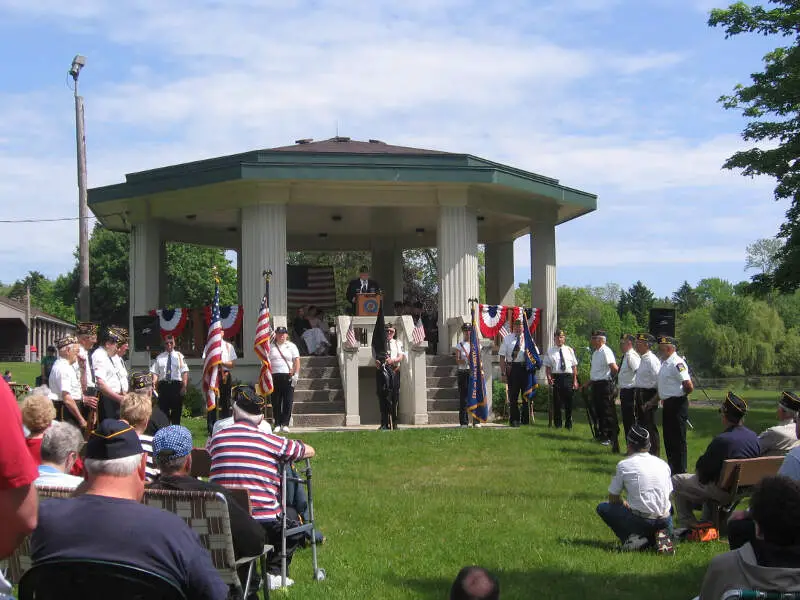
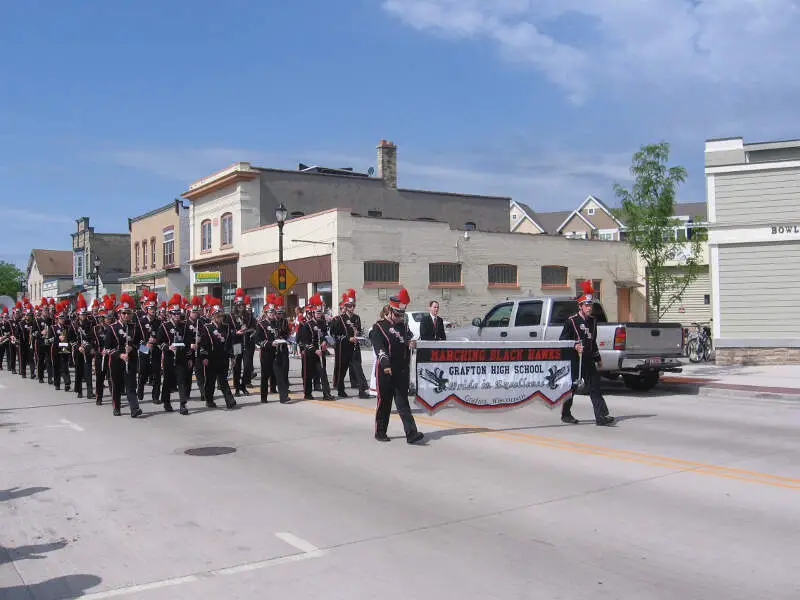
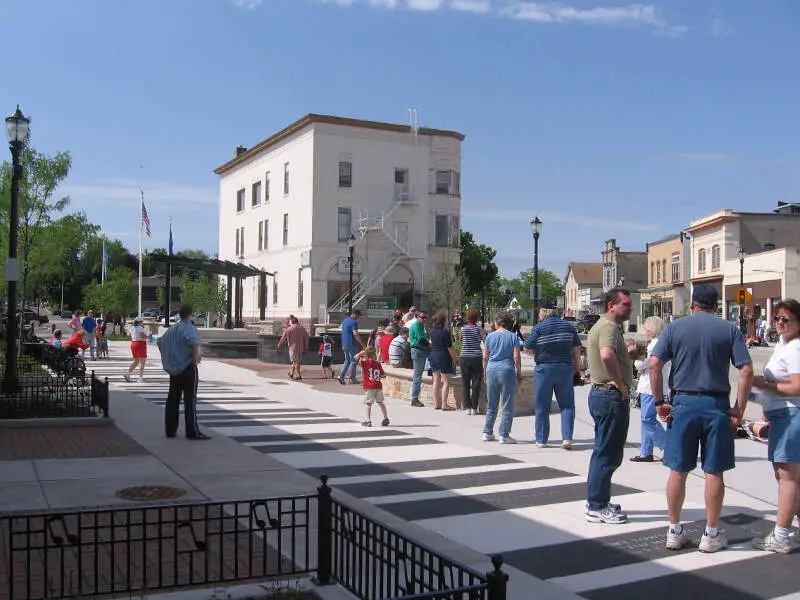
Grafton, WI Photos
Rankings for Grafton in Wisconsin


Locations Around Grafton
Map Of Grafton, WI
Best Places Around Grafton
Whitefish Bay, WI
Population 14,804
Fox Point, WI
Population 6,811
Wauwatosa, WI
Population 47,919
Cedarburg, WI
Population 12,213
Mequon, WI
Population 25,102
Menomonee Falls, WI
Population 38,610
Brookfield, WI
Population 41,342
Richfield, WI
Population 11,757
Jackson, WI
Population 7,814
Port Washington, WI
Population 12,446
Grafton Demographics And Statistics
Population over time in Grafton
The current population in Grafton is 12,160. The population has increased 7.2% from 2010.
| Year | Population | % Change |
|---|---|---|
| 2022 | 12,160 | 4.6% |
| 2021 | 11,627 | 0.4% |
| 2020 | 11,576 | 0.1% |
| 2019 | 11,563 | 0.2% |
| 2018 | 11,535 | -0.0% |
| 2017 | 11,539 | 0.4% |
| 2016 | 11,496 | 0.3% |
| 2015 | 11,457 | 0.6% |
| 2014 | 11,392 | 0.5% |
| 2013 | 11,338 | - |
Race / Ethnicity in Grafton
Grafton is:
88.4% White with 10,752 White residents.
2.5% African American with 302 African American residents.
0.0% American Indian with 0 American Indian residents.
2.3% Asian with 275 Asian residents.
0.0% Hawaiian with 0 Hawaiian residents.
0.1% Other with 7 Other residents.
3.1% Two Or More with 373 Two Or More residents.
3.7% Hispanic with 451 Hispanic residents.
| Race | Grafton | WI | USA |
|---|---|---|---|
| White | 88.4% | 79.9% | 58.9% |
| African American | 2.5% | 6.1% | 12.1% |
| American Indian | 0.0% | 0.6% | 0.6% |
| Asian | 2.3% | 2.8% | 5.7% |
| Hawaiian | 0.0% | 0.0% | 0.2% |
| Other | 0.1% | 0.2% | 0.4% |
| Two Or More | 3.1% | 3.0% | 3.5% |
| Hispanic | 3.7% | 7.3% | 18.7% |
Gender in Grafton
Grafton is 51.1% female with 6,213 female residents.
Grafton is 48.9% male with 5,946 male residents.
| Gender | Grafton | WI | USA |
|---|---|---|---|
| Female | 51.1% | 49.9% | 50.4% |
| Male | 48.9% | 50.1% | 49.6% |
Highest level of educational attainment in Grafton for adults over 25
-0.0% of adults in Grafton completed < 9th grade.
2.0% of adults in Grafton completed 9-12th grade.
20.0% of adults in Grafton completed high school / ged.
20.0% of adults in Grafton completed some college.
14.0% of adults in Grafton completed associate's degree.
28.0% of adults in Grafton completed bachelor's degree.
11.0% of adults in Grafton completed master's degree.
3.0% of adults in Grafton completed professional degree.
2.0% of adults in Grafton completed doctorate degree.
| Education | Grafton | WI | USA |
|---|---|---|---|
| < 9th Grade | -0.0% | 3.0% | 4.0% |
| 9-12th Grade | 2.0% | 4.0% | 6.0% |
| High School / GED | 20.0% | 30.0% | 26.0% |
| Some College | 20.0% | 20.0% | 20.0% |
| Associate's Degree | 14.0% | 11.0% | 9.0% |
| Bachelor's Degree | 28.0% | 21.0% | 21.0% |
| Master's Degree | 11.0% | 8.0% | 10.0% |
| Professional Degree | 3.0% | 2.0% | 2.0% |
| Doctorate Degree | 2.0% | 1.0% | 2.0% |
Household Income For Grafton, Wisconsin
2.8% of households in Grafton earn Less than $10,000.
2.6% of households in Grafton earn $10,000 to $14,999.
4.4% of households in Grafton earn $15,000 to $24,999.
12.0% of households in Grafton earn $25,000 to $34,999.
9.2% of households in Grafton earn $35,000 to $49,999.
15.4% of households in Grafton earn $50,000 to $74,999.
18.5% of households in Grafton earn $75,000 to $99,999.
18.1% of households in Grafton earn $100,000 to $149,999.
9.4% of households in Grafton earn $150,000 to $199,999.
7.5% of households in Grafton earn $200,000 or more.
| Income | Grafton | WI | USA |
|---|---|---|---|
| Less than $10,000 | 2.8% | 4.0% | 4.9% |
| $10,000 to $14,999 | 2.6% | 3.4% | 3.8% |
| $15,000 to $24,999 | 4.4% | 6.6% | 7.0% |
| $25,000 to $34,999 | 12.0% | 7.9% | 7.4% |
| $35,000 to $49,999 | 9.2% | 11.4% | 10.7% |
| $50,000 to $74,999 | 15.4% | 18.2% | 16.1% |
| $75,000 to $99,999 | 18.5% | 14.2% | 12.8% |
| $100,000 to $149,999 | 18.1% | 18.4% | 17.1% |
| $150,000 to $199,999 | 9.4% | 8.2% | 8.8% |
| $200,000 or more | 7.5% | 7.6% | 11.4% |


