Hartford, WI
Demographics And Statistics
Living In Hartford, Wisconsin Summary
Life in Hartford research summary. HomeSnacks has been using Saturday Night Science to research the quality of life in Hartford over the past nine years using Census, FBI, Zillow, and other primary data sources. Based on the most recently available data, we found the following about life in Hartford:
The population in Hartford is 15,667.
The median home value in Hartford is $324,957.
The median income in Hartford is $70,887.
The cost of living in Hartford is 98 which is 1.0x lower than the national average.
The median rent in Hartford is $990.
The unemployment rate in Hartford is 3.2%.
The poverty rate in Hartford is 8.8%.
The average high in Hartford is 55.5° and the average low is 36.0°.
Hartford SnackAbility
Overall SnackAbility
Hartford, WI Crime Report
Crime in Hartford summary. We use data from the FBI to determine the crime rates in Hartford. Key points include:
There were 102 total crimes in Hartford in the last reporting year.
The overall crime rate per 100,000 people in Hartford is 645.4 / 100k people.
The violent crime rate per 100,000 people in Hartford is 265.8 / 100k people.
The property crime rate per 100,000 people in Hartford is 379.7 / 100k people.
Overall, crime in Hartford is -72.23% below the national average.
Total Crimes
Below National Average
Crime In Hartford Comparison Table
| Statistic | Count Raw |
Hartford / 100k People |
Wisconsin / 100k People |
National / 100k People |
|---|---|---|---|---|
| Total Crimes Per 100K | 102 | 645.4 | 1,809.0 | 2,324.2 |
| Violent Crime | 42 | 265.8 | 323.4 | 369.8 |
| Murder | 0 | 0.0 | 5.3 | 6.3 |
| Robbery | 0 | 0.0 | 52.8 | 66.1 |
| Aggravated Assault | 38 | 240.5 | 230.6 | 268.2 |
| Property Crime | 60 | 379.7 | 1,485.7 | 1,954.4 |
| Burglary | 1 | 6.3 | 218.5 | 269.8 |
| Larceny | 57 | 360.7 | 1,106.1 | 1,401.9 |
| Car Theft | 2 | 12.7 | 161.0 | 282.7 |
Hartford, WI Cost Of Living
Cost of living in Hartford summary. We use data on the cost of living to determine how expensive it is to live in Hartford. Real estate prices drive most of the variance in cost of living around Wisconsin. Key points include:
The cost of living in Hartford is 98 with 100 being average.
The cost of living in Hartford is 1.0x lower than the national average.
The median home value in Hartford is $324,957.
The median income in Hartford is $70,887.
Hartford's Overall Cost Of Living
Lower Than The National Average
Cost Of Living In Hartford Comparison Table
| Living Expense | Hartford | Wisconsin | National Average | |
|---|---|---|---|---|
| Overall | 98 | 95 | 100 | |
| Services | 98 | 97 | 100 | |
| Groceries | 98 | 98 | 100 | |
| Health | 119 | 114 | 100 | |
| Housing | 91 | 84 | 100 | |
| Transportation | 95 | 96 | 100 | |
| Utilities | 109 | 103 | 100 | |
Hartford, WI Weather
The average high in Hartford is 55.5° and the average low is 36.0°.
There are 67.4 days of precipitation each year.
Expect an average of 32.9 inches of precipitation each year with 37.8 inches of snow.
| Stat | Hartford |
|---|---|
| Average Annual High | 55.5 |
| Average Annual Low | 36.0 |
| Annual Precipitation Days | 67.4 |
| Average Annual Precipitation | 32.9 |
| Average Annual Snowfall | 37.8 |
Average High
Days of Rain
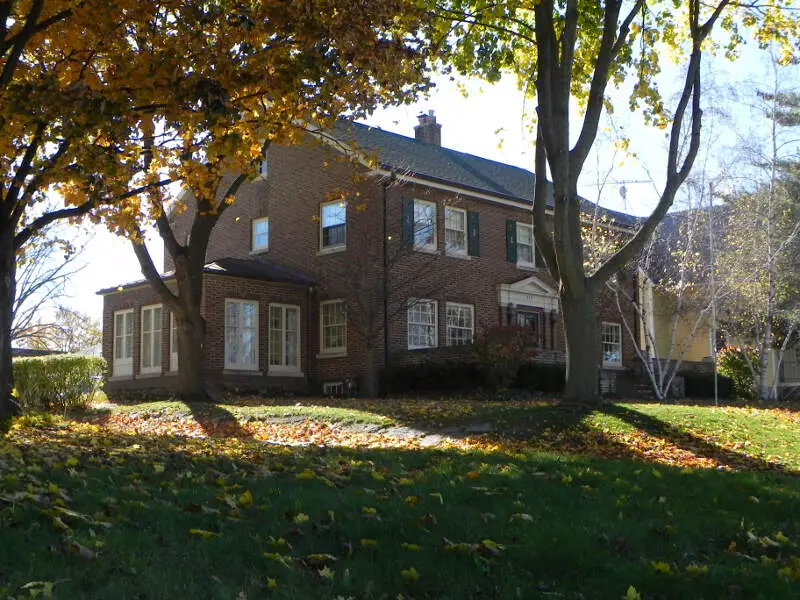
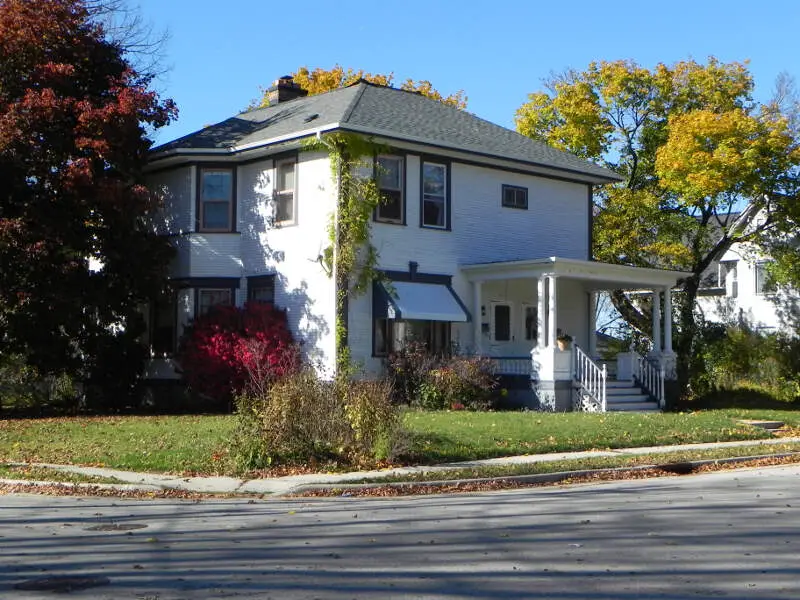
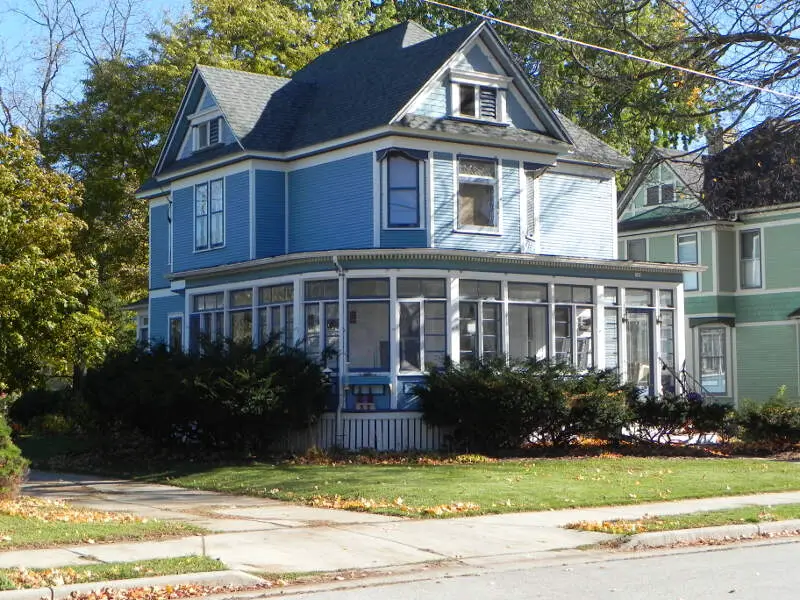
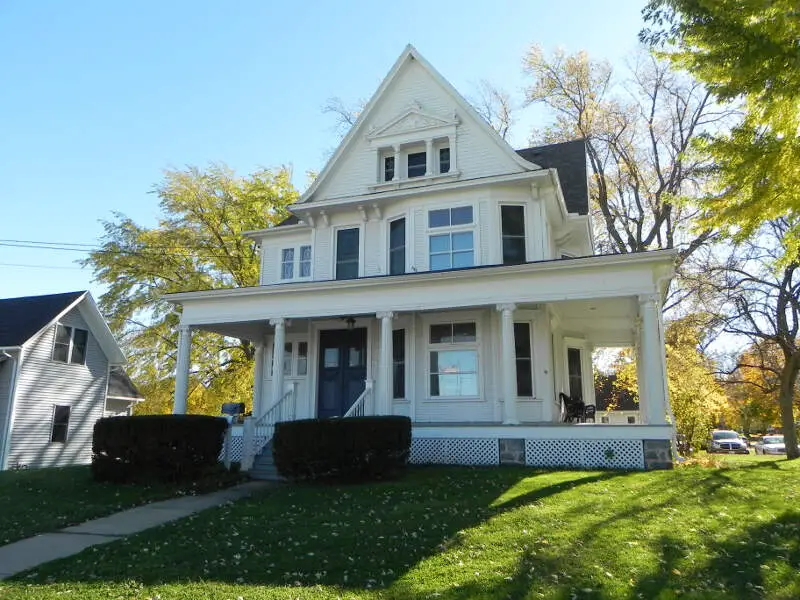
Hartford, WI Photos
Rankings for Hartford in Wisconsin


Locations Around Hartford
Map Of Hartford, WI
Best Places Around Hartford
Oconomowoc, WI
Population 18,178
Cedarburg, WI
Population 12,213
Mequon, WI
Population 25,102
Menomonee Falls, WI
Population 38,610
Hartland, WI
Population 9,599
Richfield, WI
Population 11,757
Jackson, WI
Population 7,814
Sussex, WI
Population 11,549
Delafield, WI
Population 7,181
Pewaukee, WI
Population 8,227
Hartford Demographics And Statistics
Population over time in Hartford
The current population in Hartford is 15,667. The population has increased 14.0% from 2010.
| Year | Population | % Change |
|---|---|---|
| 2022 | 15,667 | 6.1% |
| 2021 | 14,761 | 1.4% |
| 2020 | 14,552 | 1.4% |
| 2019 | 14,350 | 0.6% |
| 2018 | 14,271 | 0.1% |
| 2017 | 14,251 | 0.3% |
| 2016 | 14,209 | 0.7% |
| 2015 | 14,104 | 1.0% |
| 2014 | 13,964 | 1.6% |
| 2013 | 13,747 | - |
Race / Ethnicity in Hartford
Hartford is:
89.2% White with 13,981 White residents.
1.7% African American with 273 African American residents.
0.3% American Indian with 47 American Indian residents.
0.9% Asian with 146 Asian residents.
0.0% Hawaiian with 0 Hawaiian residents.
0.3% Other with 44 Other residents.
2.7% Two Or More with 429 Two Or More residents.
4.8% Hispanic with 747 Hispanic residents.
| Race | Hartford | WI | USA |
|---|---|---|---|
| White | 89.2% | 79.9% | 58.9% |
| African American | 1.7% | 6.1% | 12.1% |
| American Indian | 0.3% | 0.6% | 0.6% |
| Asian | 0.9% | 2.8% | 5.7% |
| Hawaiian | 0.0% | 0.0% | 0.2% |
| Other | 0.3% | 0.2% | 0.4% |
| Two Or More | 2.7% | 3.0% | 3.5% |
| Hispanic | 4.8% | 7.3% | 18.7% |
Gender in Hartford
Hartford is 51.4% female with 8,054 female residents.
Hartford is 48.6% male with 7,613 male residents.
| Gender | Hartford | WI | USA |
|---|---|---|---|
| Female | 51.4% | 49.9% | 50.4% |
| Male | 48.6% | 50.1% | 49.6% |
Highest level of educational attainment in Hartford for adults over 25
2.0% of adults in Hartford completed < 9th grade.
6.0% of adults in Hartford completed 9-12th grade.
29.0% of adults in Hartford completed high school / ged.
22.0% of adults in Hartford completed some college.
14.0% of adults in Hartford completed associate's degree.
19.0% of adults in Hartford completed bachelor's degree.
6.0% of adults in Hartford completed master's degree.
1.0% of adults in Hartford completed professional degree.
1.0% of adults in Hartford completed doctorate degree.
| Education | Hartford | WI | USA |
|---|---|---|---|
| < 9th Grade | 2.0% | 3.0% | 4.0% |
| 9-12th Grade | 6.0% | 4.0% | 6.0% |
| High School / GED | 29.0% | 30.0% | 26.0% |
| Some College | 22.0% | 20.0% | 20.0% |
| Associate's Degree | 14.0% | 11.0% | 9.0% |
| Bachelor's Degree | 19.0% | 21.0% | 21.0% |
| Master's Degree | 6.0% | 8.0% | 10.0% |
| Professional Degree | 1.0% | 2.0% | 2.0% |
| Doctorate Degree | 1.0% | 1.0% | 2.0% |
Household Income For Hartford, Wisconsin
3.9% of households in Hartford earn Less than $10,000.
4.0% of households in Hartford earn $10,000 to $14,999.
4.9% of households in Hartford earn $15,000 to $24,999.
7.9% of households in Hartford earn $25,000 to $34,999.
12.6% of households in Hartford earn $35,000 to $49,999.
19.0% of households in Hartford earn $50,000 to $74,999.
13.6% of households in Hartford earn $75,000 to $99,999.
19.9% of households in Hartford earn $100,000 to $149,999.
8.7% of households in Hartford earn $150,000 to $199,999.
5.4% of households in Hartford earn $200,000 or more.
| Income | Hartford | WI | USA |
|---|---|---|---|
| Less than $10,000 | 3.9% | 4.0% | 4.9% |
| $10,000 to $14,999 | 4.0% | 3.4% | 3.8% |
| $15,000 to $24,999 | 4.9% | 6.6% | 7.0% |
| $25,000 to $34,999 | 7.9% | 7.9% | 7.4% |
| $35,000 to $49,999 | 12.6% | 11.4% | 10.7% |
| $50,000 to $74,999 | 19.0% | 18.2% | 16.1% |
| $75,000 to $99,999 | 13.6% | 14.2% | 12.8% |
| $100,000 to $149,999 | 19.9% | 18.4% | 17.1% |
| $150,000 to $199,999 | 8.7% | 8.2% | 8.8% |
| $200,000 or more | 5.4% | 7.6% | 11.4% |


