Racine, WI
Demographics And Statistics
Living In Racine, Wisconsin Summary
Life in Racine research summary. HomeSnacks has been using Saturday Night Science to research the quality of life in Racine over the past nine years using Census, FBI, Zillow, and other primary data sources. Based on the most recently available data, we found the following about life in Racine:
The population in Racine is 77,453.
The median home value in Racine is $174,516.
The median income in Racine is $52,766.
The cost of living in Racine is 89 which is 0.9x lower than the national average.
The median rent in Racine is $967.
The unemployment rate in Racine is 6.0%.
The poverty rate in Racine is 19.2%.
The average high in Racine is 55.0° and the average low is 39.8°.
Racine SnackAbility
Overall SnackAbility
Racine, WI Crime Report
Crime in Racine summary. We use data from the FBI to determine the crime rates in Racine. Key points include:
There were 1,487 total crimes in Racine in the last reporting year.
The overall crime rate per 100,000 people in Racine is 1,939.3 / 100k people.
The violent crime rate per 100,000 people in Racine is 434.3 / 100k people.
The property crime rate per 100,000 people in Racine is 1,505.0 / 100k people.
Overall, crime in Racine is -16.56% below the national average.
Total Crimes
Below National Average
Crime In Racine Comparison Table
| Statistic | Count Raw |
Racine / 100k People |
Wisconsin / 100k People |
National / 100k People |
|---|---|---|---|---|
| Total Crimes Per 100K | 1,487 | 1,939.3 | 1,809.0 | 2,324.2 |
| Violent Crime | 333 | 434.3 | 323.4 | 369.8 |
| Murder | 5 | 6.5 | 5.3 | 6.3 |
| Robbery | 68 | 88.7 | 52.8 | 66.1 |
| Aggravated Assault | 230 | 300.0 | 230.6 | 268.2 |
| Property Crime | 1,154 | 1,505.0 | 1,485.7 | 1,954.4 |
| Burglary | 339 | 442.1 | 218.5 | 269.8 |
| Larceny | 647 | 843.8 | 1,106.1 | 1,401.9 |
| Car Theft | 168 | 219.1 | 161.0 | 282.7 |
Racine, WI Cost Of Living
Cost of living in Racine summary. We use data on the cost of living to determine how expensive it is to live in Racine. Real estate prices drive most of the variance in cost of living around Wisconsin. Key points include:
The cost of living in Racine is 89 with 100 being average.
The cost of living in Racine is 0.9x lower than the national average.
The median home value in Racine is $174,516.
The median income in Racine is $52,766.
Racine's Overall Cost Of Living
Lower Than The National Average
Cost Of Living In Racine Comparison Table
| Living Expense | Racine | Wisconsin | National Average | |
|---|---|---|---|---|
| Overall | 89 | 95 | 100 | |
| Services | 97 | 97 | 100 | |
| Groceries | 95 | 98 | 100 | |
| Health | 120 | 114 | 100 | |
| Housing | 63 | 84 | 100 | |
| Transportation | 94 | 96 | 100 | |
| Utilities | 109 | 103 | 100 | |
Racine, WI Weather
The average high in Racine is 55.0° and the average low is 39.8°.
There are 69.9 days of precipitation each year.
Expect an average of 35.7 inches of precipitation each year with 41.6 inches of snow.
| Stat | Racine |
|---|---|
| Average Annual High | 55.0 |
| Average Annual Low | 39.8 |
| Annual Precipitation Days | 69.9 |
| Average Annual Precipitation | 35.7 |
| Average Annual Snowfall | 41.6 |
Average High
Days of Rain
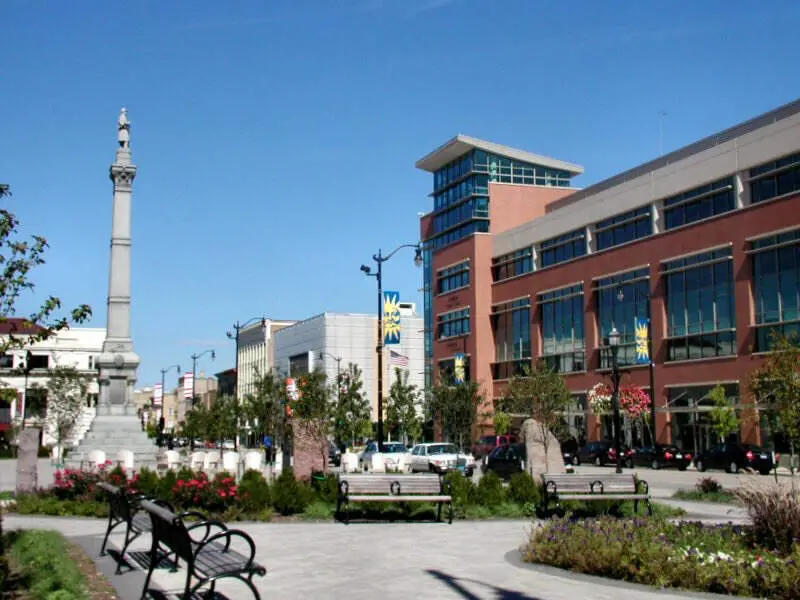
Racine, WI Photos
2 Reviews & Comments About Racine
/5

VideoGamingz -
I don't care what you say, I've lived in Racine for ten years and I didn't get robbed or see anyone get robbed.Take this from the Person who actually lives there.
HomeSnacks User - 2019-05-01 01:44:48.147127
It's been an okay experience. Most of the city is very scary and worn down. Very nice by the lake. The schools feel like a prison. I've been threatened by students I've never met. A mother walked into my high school threatening to beat up students and shoot them. Security is atrocious. When I have attempted to reported bullying the staff in my schools office refused to talk to me. I'm a college bound AP student and feel like a criminal for asking to go to the bathroom. The halls smell like marijuana. Attending a public high school in Racine has destroyed my mental health. The teachers complain about central office and administrators. Teachers also have heated political debates in class. Teachers recruit students to attend political protests. Very stressful environment when the staff talks about how much they hate their jobs. I have had a bad experience with violence and crime inside and outside of the schools.
There are many things to do in Racine. Summers are amazing down by the lake. However, the schools are disgusting. Class rooms haven't been properly cleaned in years and even smell like urine. That is what William Horlick High School and Washington Park High School are like. Many dangerous neighborhoods. Diversity is good and some nice neighborhoods by the lake. Most of Racine is worn down and scary.
Rankings for Racine in Wisconsin


Locations Around Racine
Map Of Racine, WI
Best Places Around Racine
Winthrop Harbor, IL
Population 6,693
Muskego, WI
Population 25,073
Franklin, WI
Population 36,513
Wind Lake, WI
Population 5,094
Hales Corners, WI
Population 7,677
Pleasant Prairie, WI
Population 21,373
Zion, IL
Population 24,570
Greendale, WI
Population 14,722
Oak Creek, WI
Population 36,286
Cudahy, WI
Population 18,087
Racine Demographics And Statistics
Population over time in Racine
The current population in Racine is 77,453. The population has decreased -2.8% from 2010.
| Year | Population | % Change |
|---|---|---|
| 2022 | 77,453 | -0.2% |
| 2021 | 77,576 | -0.2% |
| 2020 | 77,740 | -0.2% |
| 2019 | 77,931 | -0.3% |
| 2018 | 78,127 | -0.3% |
| 2017 | 78,347 | -0.3% |
| 2016 | 78,548 | -0.4% |
| 2015 | 78,878 | -0.6% |
| 2014 | 79,350 | -0.4% |
| 2013 | 79,664 | - |
Race / Ethnicity in Racine
Racine is:
50.3% White with 38,938 White residents.
21.1% African American with 16,369 African American residents.
0.2% American Indian with 133 American Indian residents.
0.9% Asian with 670 Asian residents.
0.0% Hawaiian with 13 Hawaiian residents.
0.3% Other with 217 Other residents.
3.9% Two Or More with 3,019 Two Or More residents.
23.4% Hispanic with 18,094 Hispanic residents.
| Race | Racine | WI | USA |
|---|---|---|---|
| White | 50.3% | 79.9% | 58.9% |
| African American | 21.1% | 6.1% | 12.1% |
| American Indian | 0.2% | 0.6% | 0.6% |
| Asian | 0.9% | 2.8% | 5.7% |
| Hawaiian | 0.0% | 0.0% | 0.2% |
| Other | 0.3% | 0.2% | 0.4% |
| Two Or More | 3.9% | 3.0% | 3.5% |
| Hispanic | 23.4% | 7.3% | 18.7% |
Gender in Racine
Racine is 51.9% female with 40,234 female residents.
Racine is 48.1% male with 37,219 male residents.
| Gender | Racine | WI | USA |
|---|---|---|---|
| Female | 51.9% | 49.9% | 50.4% |
| Male | 48.1% | 50.1% | 49.6% |
Highest level of educational attainment in Racine for adults over 25
3.0% of adults in Racine completed < 9th grade.
8.0% of adults in Racine completed 9-12th grade.
32.0% of adults in Racine completed high school / ged.
25.0% of adults in Racine completed some college.
10.0% of adults in Racine completed associate's degree.
15.0% of adults in Racine completed bachelor's degree.
5.0% of adults in Racine completed master's degree.
1.0% of adults in Racine completed professional degree.
1.0% of adults in Racine completed doctorate degree.
| Education | Racine | WI | USA |
|---|---|---|---|
| < 9th Grade | 3.0% | 3.0% | 4.0% |
| 9-12th Grade | 8.0% | 4.0% | 6.0% |
| High School / GED | 32.0% | 30.0% | 26.0% |
| Some College | 25.0% | 20.0% | 20.0% |
| Associate's Degree | 10.0% | 11.0% | 9.0% |
| Bachelor's Degree | 15.0% | 21.0% | 21.0% |
| Master's Degree | 5.0% | 8.0% | 10.0% |
| Professional Degree | 1.0% | 2.0% | 2.0% |
| Doctorate Degree | 1.0% | 1.0% | 2.0% |
Household Income For Racine, Wisconsin
6.1% of households in Racine earn Less than $10,000.
5.9% of households in Racine earn $10,000 to $14,999.
9.0% of households in Racine earn $15,000 to $24,999.
8.8% of households in Racine earn $25,000 to $34,999.
16.4% of households in Racine earn $35,000 to $49,999.
22.1% of households in Racine earn $50,000 to $74,999.
12.4% of households in Racine earn $75,000 to $99,999.
12.1% of households in Racine earn $100,000 to $149,999.
4.5% of households in Racine earn $150,000 to $199,999.
2.6% of households in Racine earn $200,000 or more.
| Income | Racine | WI | USA |
|---|---|---|---|
| Less than $10,000 | 6.1% | 4.0% | 4.9% |
| $10,000 to $14,999 | 5.9% | 3.4% | 3.8% |
| $15,000 to $24,999 | 9.0% | 6.6% | 7.0% |
| $25,000 to $34,999 | 8.8% | 7.9% | 7.4% |
| $35,000 to $49,999 | 16.4% | 11.4% | 10.7% |
| $50,000 to $74,999 | 22.1% | 18.2% | 16.1% |
| $75,000 to $99,999 | 12.4% | 14.2% | 12.8% |
| $100,000 to $149,999 | 12.1% | 18.4% | 17.1% |
| $150,000 to $199,999 | 4.5% | 8.2% | 8.8% |
| $200,000 or more | 2.6% | 7.6% | 11.4% |


